<?xml version="1.0" encoding="utf-8"?><feed xmlns="http://www.w3.org/2005/Atom" ><generator uri="https://jekyllrb.com/" version="3.10.0">Jekyll</generator><link href="https://es617.dev/feed.xml" rel="self" type="application/atom+xml" /><link href="https://es617.dev/" rel="alternate" type="text/html" /><updated>2026-07-16T18:33:30+00:00</updated><id>https://es617.dev/feed.xml</id><title type="html">es617’s blog</title><subtitle>Enrico Santagati&apos;s blog</subtitle><author><name>Enrico Santagati</name></author><entry><title type="html">Let the AI Out: Audient — An Ambient Audio Perception Layer That Grows</title><link href="https://es617.dev/2026/07/07/audient-ears.html" rel="alternate" type="text/html" title="Let the AI Out: Audient — An Ambient Audio Perception Layer That Grows" /><published>2026-07-07T00:00:00+00:00</published><updated>2026-07-07T00:00:00+00:00</updated><id>https://es617.dev/2026/07/07/audient-ears</id><content type="html" xml:base="https://es617.dev/2026/07/07/audient-ears.html"><![CDATA[<hr />
<blockquote>
  <p><em>This post is part of the <a href="/let-the-ai-out/">Let the AI Out</a> series on giving AI agents direct access to the physical world. <a href="/let-the-ai-out/">Start here</a> for the overview.</em></p>
</blockquote>

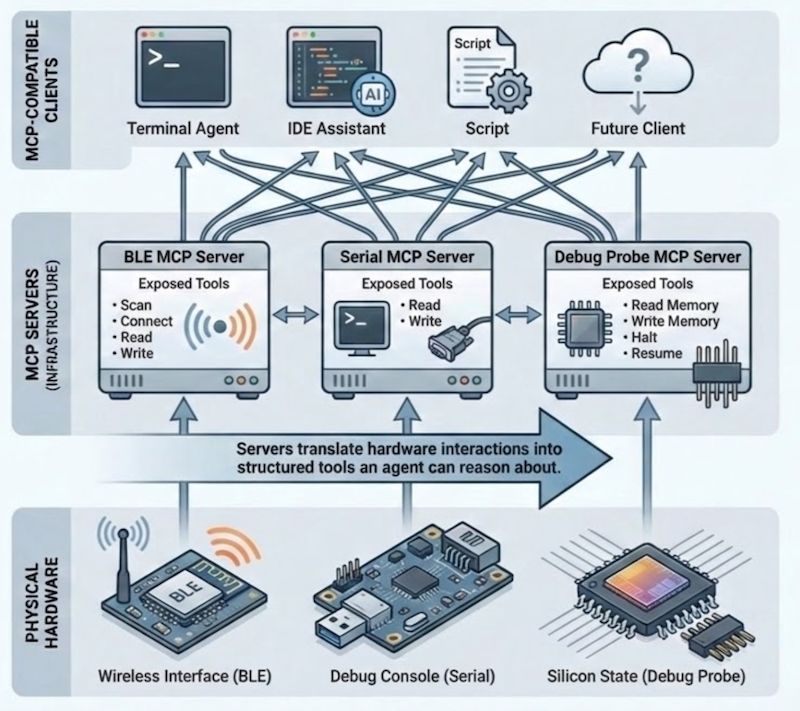
<p>This series has been about giving agents <em>hands</em> — <a href="/2026/02/10/ble-mcp-server.html">BLE</a>, <a href="/2026/02/15/serial-mcp-server.html">serial</a>, the <a href="/2026/03/01/debug-probe-mcp-server.html">debug probe</a>. Channels the agent opens and closes when it’s done.</p>

<p>Agents already consume vision, text, and speech fine. You hand them an image, they tell you what’s in it; speech they get too, once a speech-to-text model has done its job. All of it is <em>requested</em> input: someone pointed, someone asked, someone hit record.</p>

<p>What about audio that isn’t speech?</p>

<p>A bird singing outside while you read. A glass breaking two rooms away. A smoke-alarm ringing. Whether any of that matters depends on context, and no fixed classifier gets you there. What gets you there is a vocabulary of what you’ve heard before, and a way to grow it.</p>

<p>That’s what <a href="https://github.com/es617/audient">audient</a> is: an experimental audio perception layer for AI agents — an MCP server plus a browser viewer, one repo, one install. Continuous audio in, event-gated recognition out, a concept memory that grows through use, and a registry of specialized audio models the agent chains as it needs them.</p>

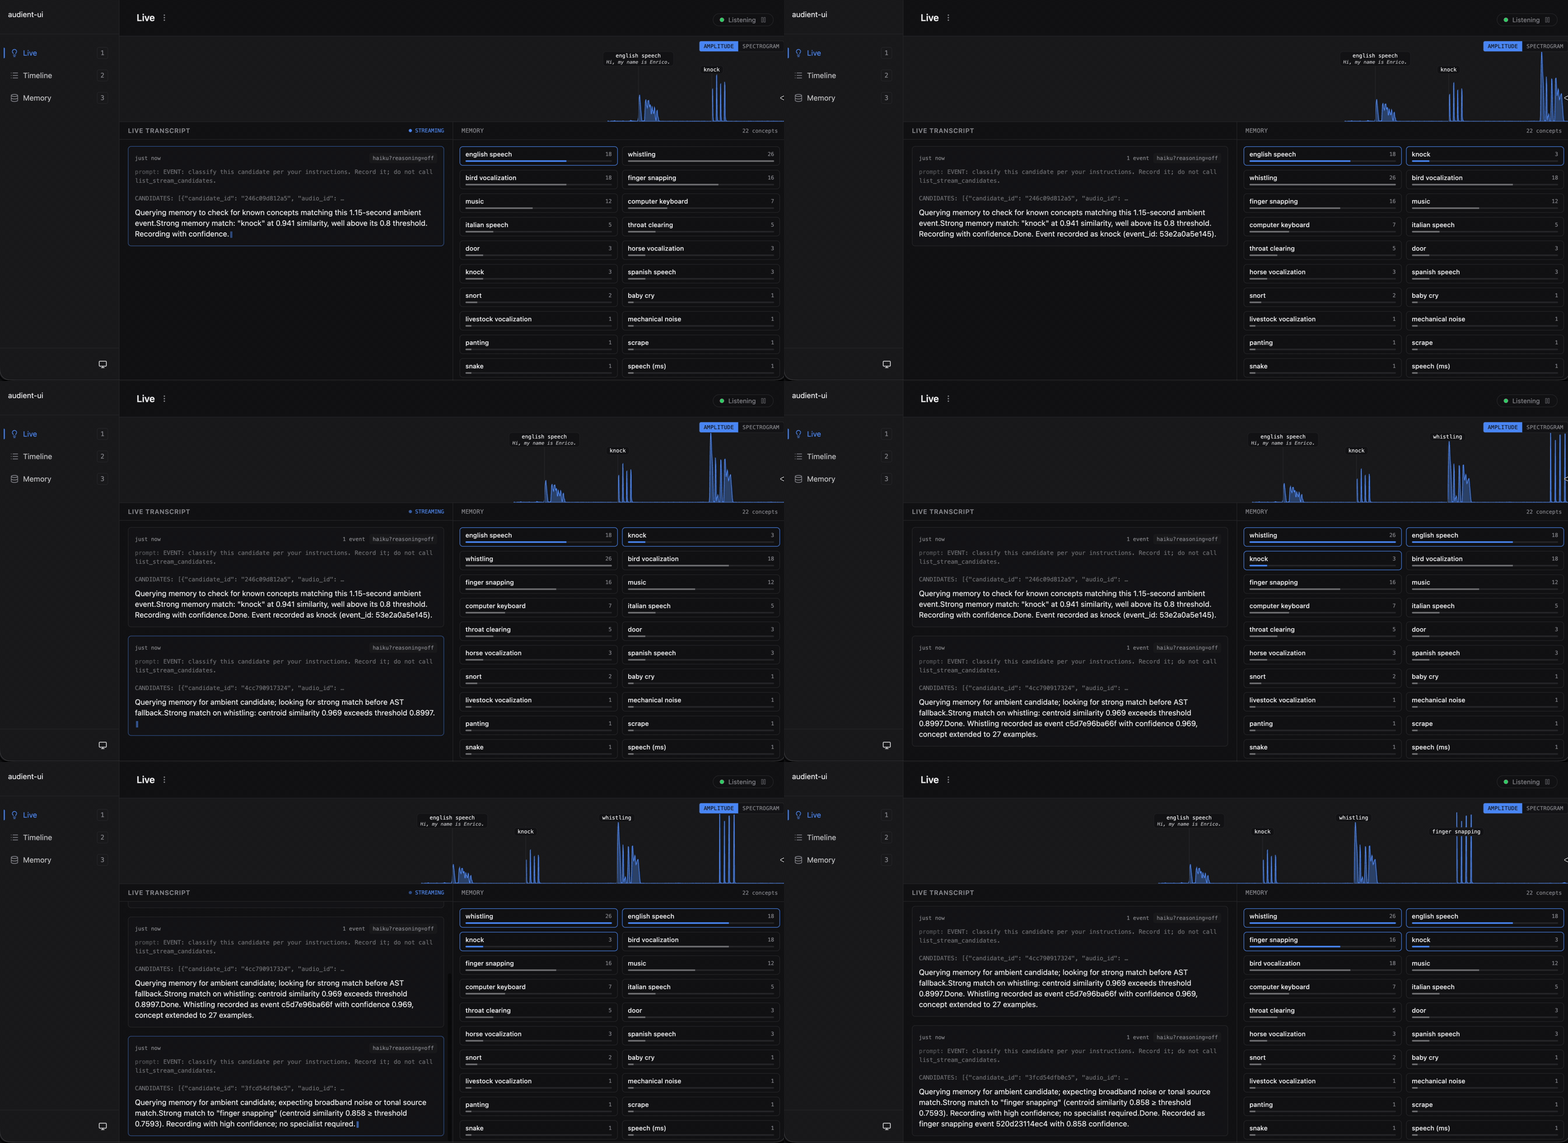
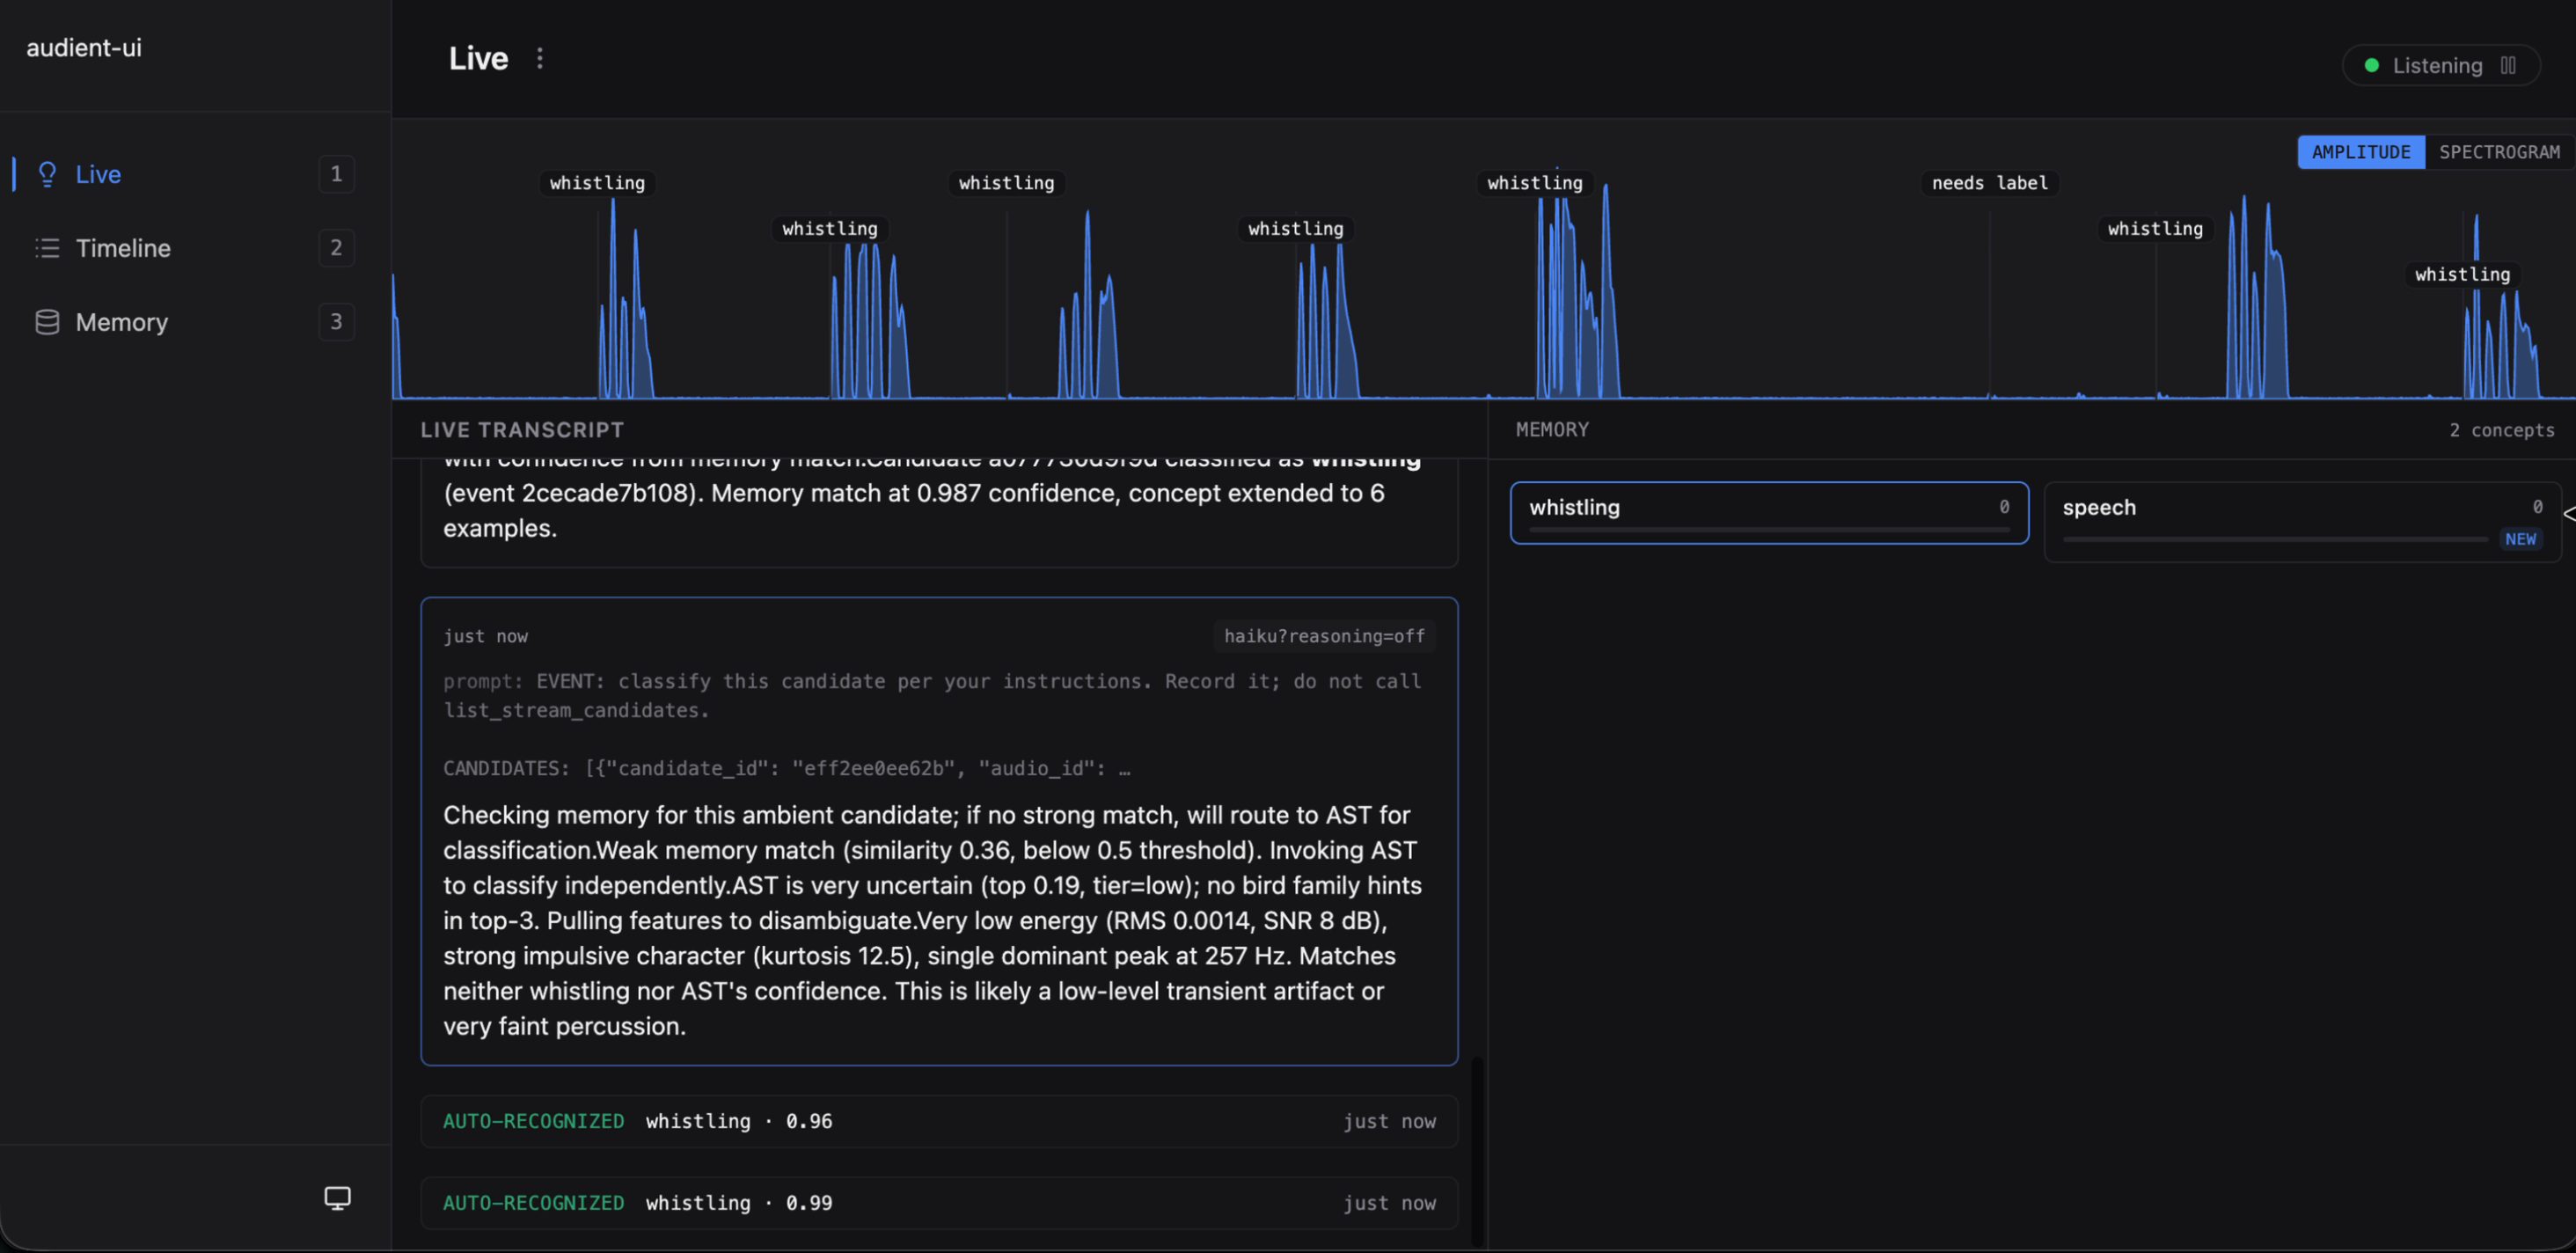
<p><img src="/assets/images/posts/audient-ears/hero.gif" alt="audient's Live surface: audio scope on top, live classifier reasoning streaming in a side panel, memory grid pulsing as recognized events land" class="align-center" /></p>

<p>Useful anywhere an agent should notice audio it wasn’t told to listen for: a robot that reacts to a crash it wasn’t watching for, an assistant that hears the oven’s still beeping, an industrial monitor that catches a bearing before it fails, an ecological deployment tracking a species that showed up where it shouldn’t. Mostly, I built it to see if the loop worked.</p>

<hr />

<h2 id="how-an-ear-becomes-a-perception">How an ear becomes a perception</h2>

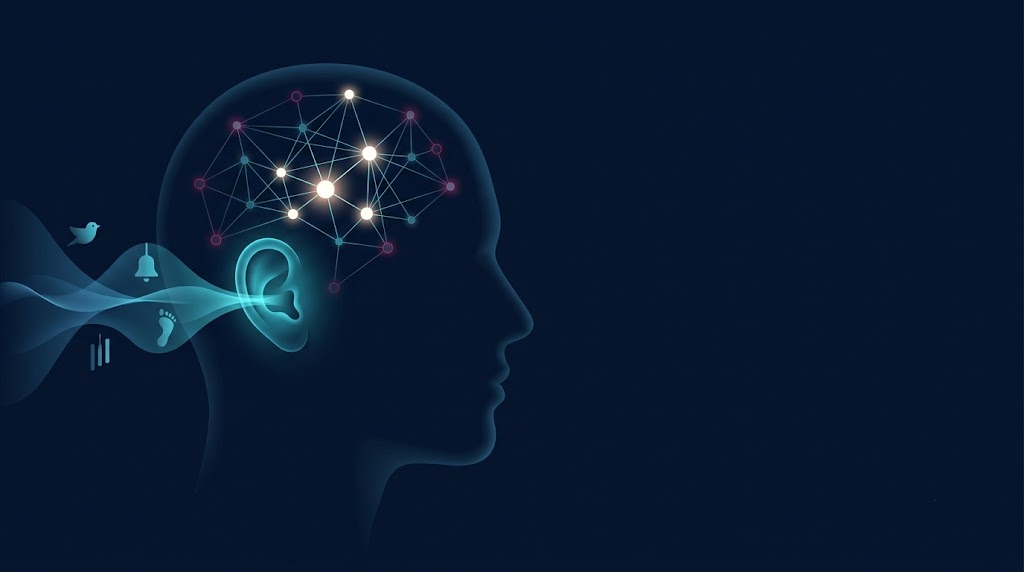
<p><img src="/assets/images/posts/audient-ears/ear-to-brain.png" alt="Head in profile, sound entering the ear, a growing constellation of connected concept-nodes lighting up inside the brain" class="align-center" /></p>

<p>Roughly four stages, each doing one thing.</p>

<ol>
  <li><strong>A peripheral gate.</strong> The cochlea and brainstem don’t pass everything upstream. Onsets, transients, energy changes (the things that <em>might</em> be signal) get amplified; steady background gets attenuated. The first “decision” is “<em>is this worth attending to?</em>”, and it is made before any recognition has happened.</li>
  <li><strong>A fingerprint.</strong> The signal gets encoded as a distinctive pattern of neural activity, organized by frequency, changing over time. Not a stored recording; a shape the rest of the system compares against past patterns.</li>
  <li><strong>A working-memory match.</strong> The fingerprint gets compared against everything you’ve heard before that’s still organized enough to retrieve. Familiar → strong match, fast recognition. Unfamiliar → no match, attention flares.</li>
  <li><strong>Specialized modules, when they apply.</strong> Speech, music, and environmental sound each get routed to different cortical regions, each tuned to its domain. Recognition isn’t one classifier: it’s a set of specialists the system picks from.</li>
</ol>

<p>There’s a fifth thing, the part that makes the whole loop close: <strong>you can look or ask.</strong> You hear something you don’t know, and you turn your head, or you ask the person next to you “what was that?” Then the next time it happens you know.</p>

<hr />

<h2 id="the-same-four-stages-in-code">The same four stages, in code</h2>

<p>The audient growth loop mirrors the biology stage-for-stage:</p>

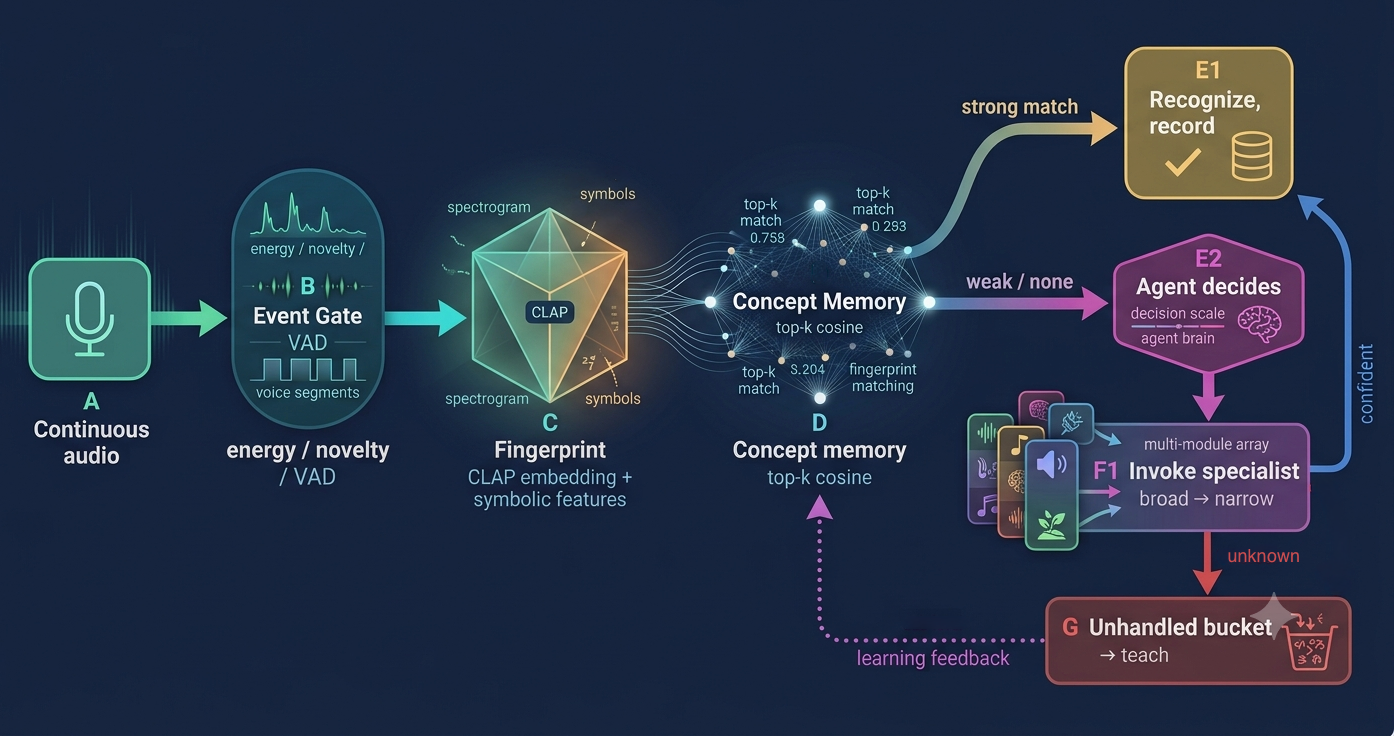
<p><img src="/assets/images/posts/audient-ears/pipeline.png" alt="Pipeline flow: continuous audio → event gate (energy / novelty / VAD) → fingerprint (CLAP embedding + symbolic features) → concept memory (top-k cosine). Strong match branches to recognize/record; weak or none goes to the agent, which invokes a specialist broad→narrow, either recording the result or sending it to the unhandled bucket for teaching" class="align-center" /></p>

<ul>
  <li><strong>Event gate.</strong> Energy, novelty, and voice-activity detection trim the continuous signal down to candidate regions. Most of the audio never reaches the rest of the system.</li>
  <li><strong>Fingerprint.</strong> Every candidate gets a <a href="https://github.com/LAION-AI/CLAP">CLAP</a> embedding (the dense, comparable form) <em>and</em> a panel of symbolic features (spectral shape, peaks with prominence, harmonic content, temporal stability, energy and noise floor, etc.). The embedding is for math; the symbolic features are for the agent to reason about.</li>
  <li><strong>Concept memory.</strong> A <a href="https://github.com/asg017/sqlite-vec">sqlite-vec</a> store of every concept the agent has learned. Each candidate’s embedding gets a top-k cosine lookup. Strong match against a calibrated concept (above its threshold) fires recognition server-side, optionally invoking the concept’s linked specialist to enrich the event. No agent in the loop. Anything weaker surfaces to the agent.</li>
  <li><strong>Specialists.</strong> A registry of pre-trained classifiers. <a href="https://github.com/openai/whisper">Whisper</a> for speech. <a href="https://github.com/kahst/birdnetlib">BirdNET</a> for bioacoustics. <a href="https://github.com/YuanGongND/ast">AST</a> (AudioSet, 527 coarse labels) as the broad-coverage fallback the agent reaches for first when memory misses. Each declares, in plain English, <em>when to use it</em>, its <em>failure modes</em>, and how to <em>interpret its confidence</em>.</li>
  <li><strong>Unhandled bucket.</strong> Events the agent couldn’t recognize land here, waiting for a teacher.</li>
</ul>

<p>Two paths. For familiar, calibrated concepts, the server recognizes directly: fast, automatic, no agent involved. For everything else, the MCP server exposes the tools and the agent sequences them itself. The dispatcher is the LLM whenever there’s a decision worth making.</p>
<hr />

<h2 id="three-ways-to-reason-about-a-sound">Three ways to reason about a sound</h2>

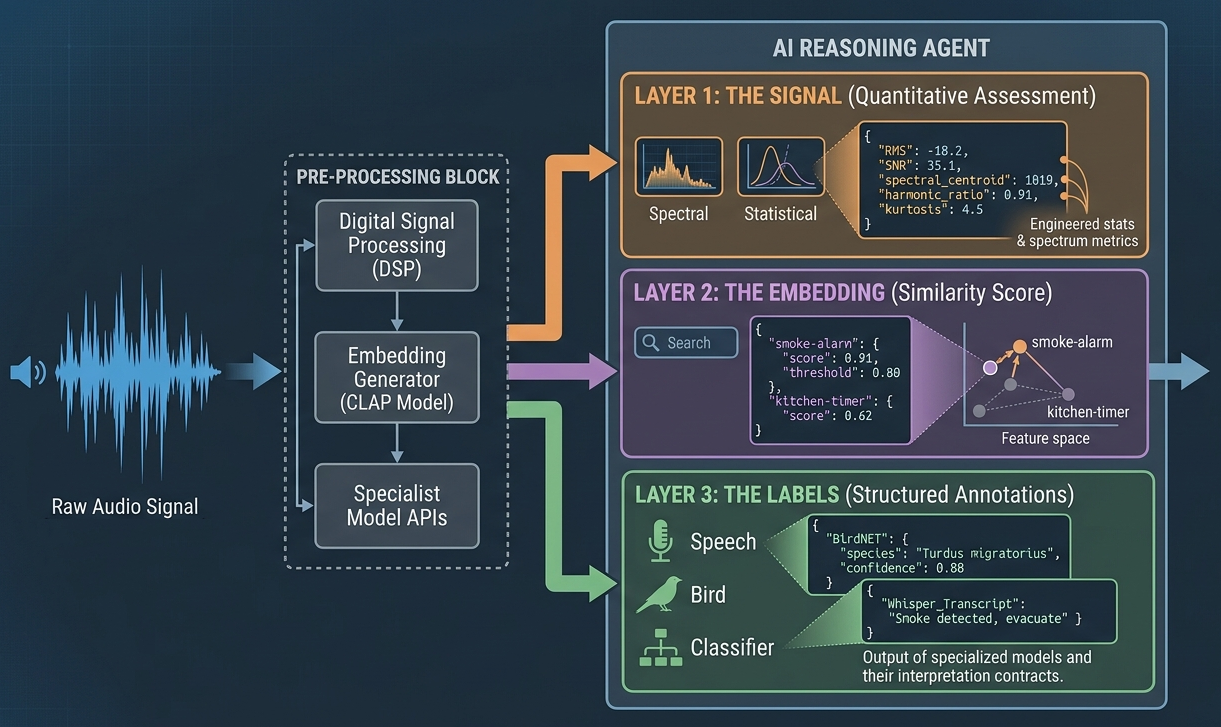
<p><strong>The agent reasons over symbolic representations, never raw audio.</strong> The architecture gives it three layers to reason across.</p>

<p><img src="/assets/images/posts/audient-ears/three-layers.png" alt="Diagram: raw audio enters a pre-processing block (DSP, CLAP embedding, specialist APIs); the agent reasons across three symbolic layers — signal features as JSON, embedding similarity scores against concept memory, and structured specialist labels. The raw audio itself is discarded and never seen by the agent." class="align-center" /></p>

<p><strong>The signal.</strong> Analysis tools (e.g., <code class="language-plaintext highlighter-rouge">spectrum</code>) return plain numbers: roughly two dozen features spanning energy, spectral shape, harmonic content, peaks, and temporal drift. The agent reads them as JSON and reasons about them the way an audio engineer would. <em>Strong peak at 1019Hz, 38dB prominence, harmonic ratio 0.91. That’s tonal, not broadband. Low temporal drift: it’s sustained, not a transient.</em></p>

<p><strong>The embedding.</strong> The agent never sees the CLAP vector itself. It sees the <em>similarity score</em> against everything in concept memory. <code class="language-plaintext highlighter-rouge">query_memory</code> returns the top-k matches with their cosine similarity, the concept’s threshold, and the recognizer kind. <em>0.91 against <code class="language-plaintext highlighter-rouge">smoke-alarm</code>, threshold 0.80: confident match. 0.62 against <code class="language-plaintext highlighter-rouge">kitchen-timer</code>, 0.58 against <code class="language-plaintext highlighter-rouge">microwave-beep</code>: neighbors, not matches.</em></p>

<p><strong>The labels.</strong> Specialists return structured labels. Whisper transcripts. BirdNET species with confidence. AST’s coarse AudioSet guess across 527 categories. The agent hands a sound off via <code class="language-plaintext highlighter-rouge">invoke_specialist</code> and reads back the structured answer alongside the specialist’s plain-English contract for how to interpret it.</p>

<p>The agent can disagree with the specialist if the signal features don’t fit. It can override the embedding similarity if the labels suggest the categories diverged. No single layer is authoritative.</p>

<hr />

<h2 id="when-you-hear-something-you-dont-know">When you hear something you don’t know</h2>

<p>The unhandled bucket is the <em>turn your head and ask</em> primitive.</p>

<p>When concept memory has no good match and no specialist comes back confident, the event lands in a queue of pre-trimmed audio clips with their fingerprints and whatever the system <em>thinks</em> it heard, waiting for a teacher. The teacher pulls from it and labels the sound with a name. That name becomes a concept the store can find on the next similar event.</p>

<p>Today the teacher is a human. The natural extension is cross-modal: an agent that hears something unfamiliar and looks toward the source with a camera, then labels the sound with what it saw. <em>Crash in the kitchen</em> → vision sees broken glass → labels the sound as <code class="language-plaintext highlighter-rouge">glass-break</code>.</p>

<hr />

<h2 id="handing-off-to-specialists">Handing off to specialists</h2>

<p>The auditory cortex has specialized regions for different domains: Wernicke’s area for speech, lateral belt for environmental sound, regions for music. The system mirrors that: no monolithic audio model, a registry of specialists instead, each declaring what it’s for in plain English the agent can read.</p>

<p>Three specialists ship today. The agent picks who to delegate to. AST is what it reaches for first when memory misses (broad coverage, fast), and the result tells it whether to follow up with BirdNET, Whisper, or nothing. The contract for each specialist (<code class="language-plaintext highlighter-rouge">when_to_use</code>, <code class="language-plaintext highlighter-rouge">failure_modes</code>, <code class="language-plaintext highlighter-rouge">confidence_interpretation</code>) is what lets an LLM reason about a classifier it didn’t train.</p>

<p>Adding a new specialist is registering a <code class="language-plaintext highlighter-rouge">spec.yaml</code> and an <code class="language-plaintext highlighter-rouge">adapter.py</code>. The agent reads the spec and decides when to use it. The same slot can hold specialists trained from the store itself as vocabulary accumulates; a system that can self-extend.</p>

<hr />

<h2 id="how-a-concept-grows">How a concept grows</h2>

<p>The clearest way to see what this system does is to follow one sound through its life in the store. A simple example, no specialist involved.</p>

<blockquote>
  <p><em>Prefer to watch the whole thing? <a href="https://www.youtube.com/watch?v=6ofyj-2gQ8c">Full 90-second demo on YouTube</a>.</em></p>
</blockquote>

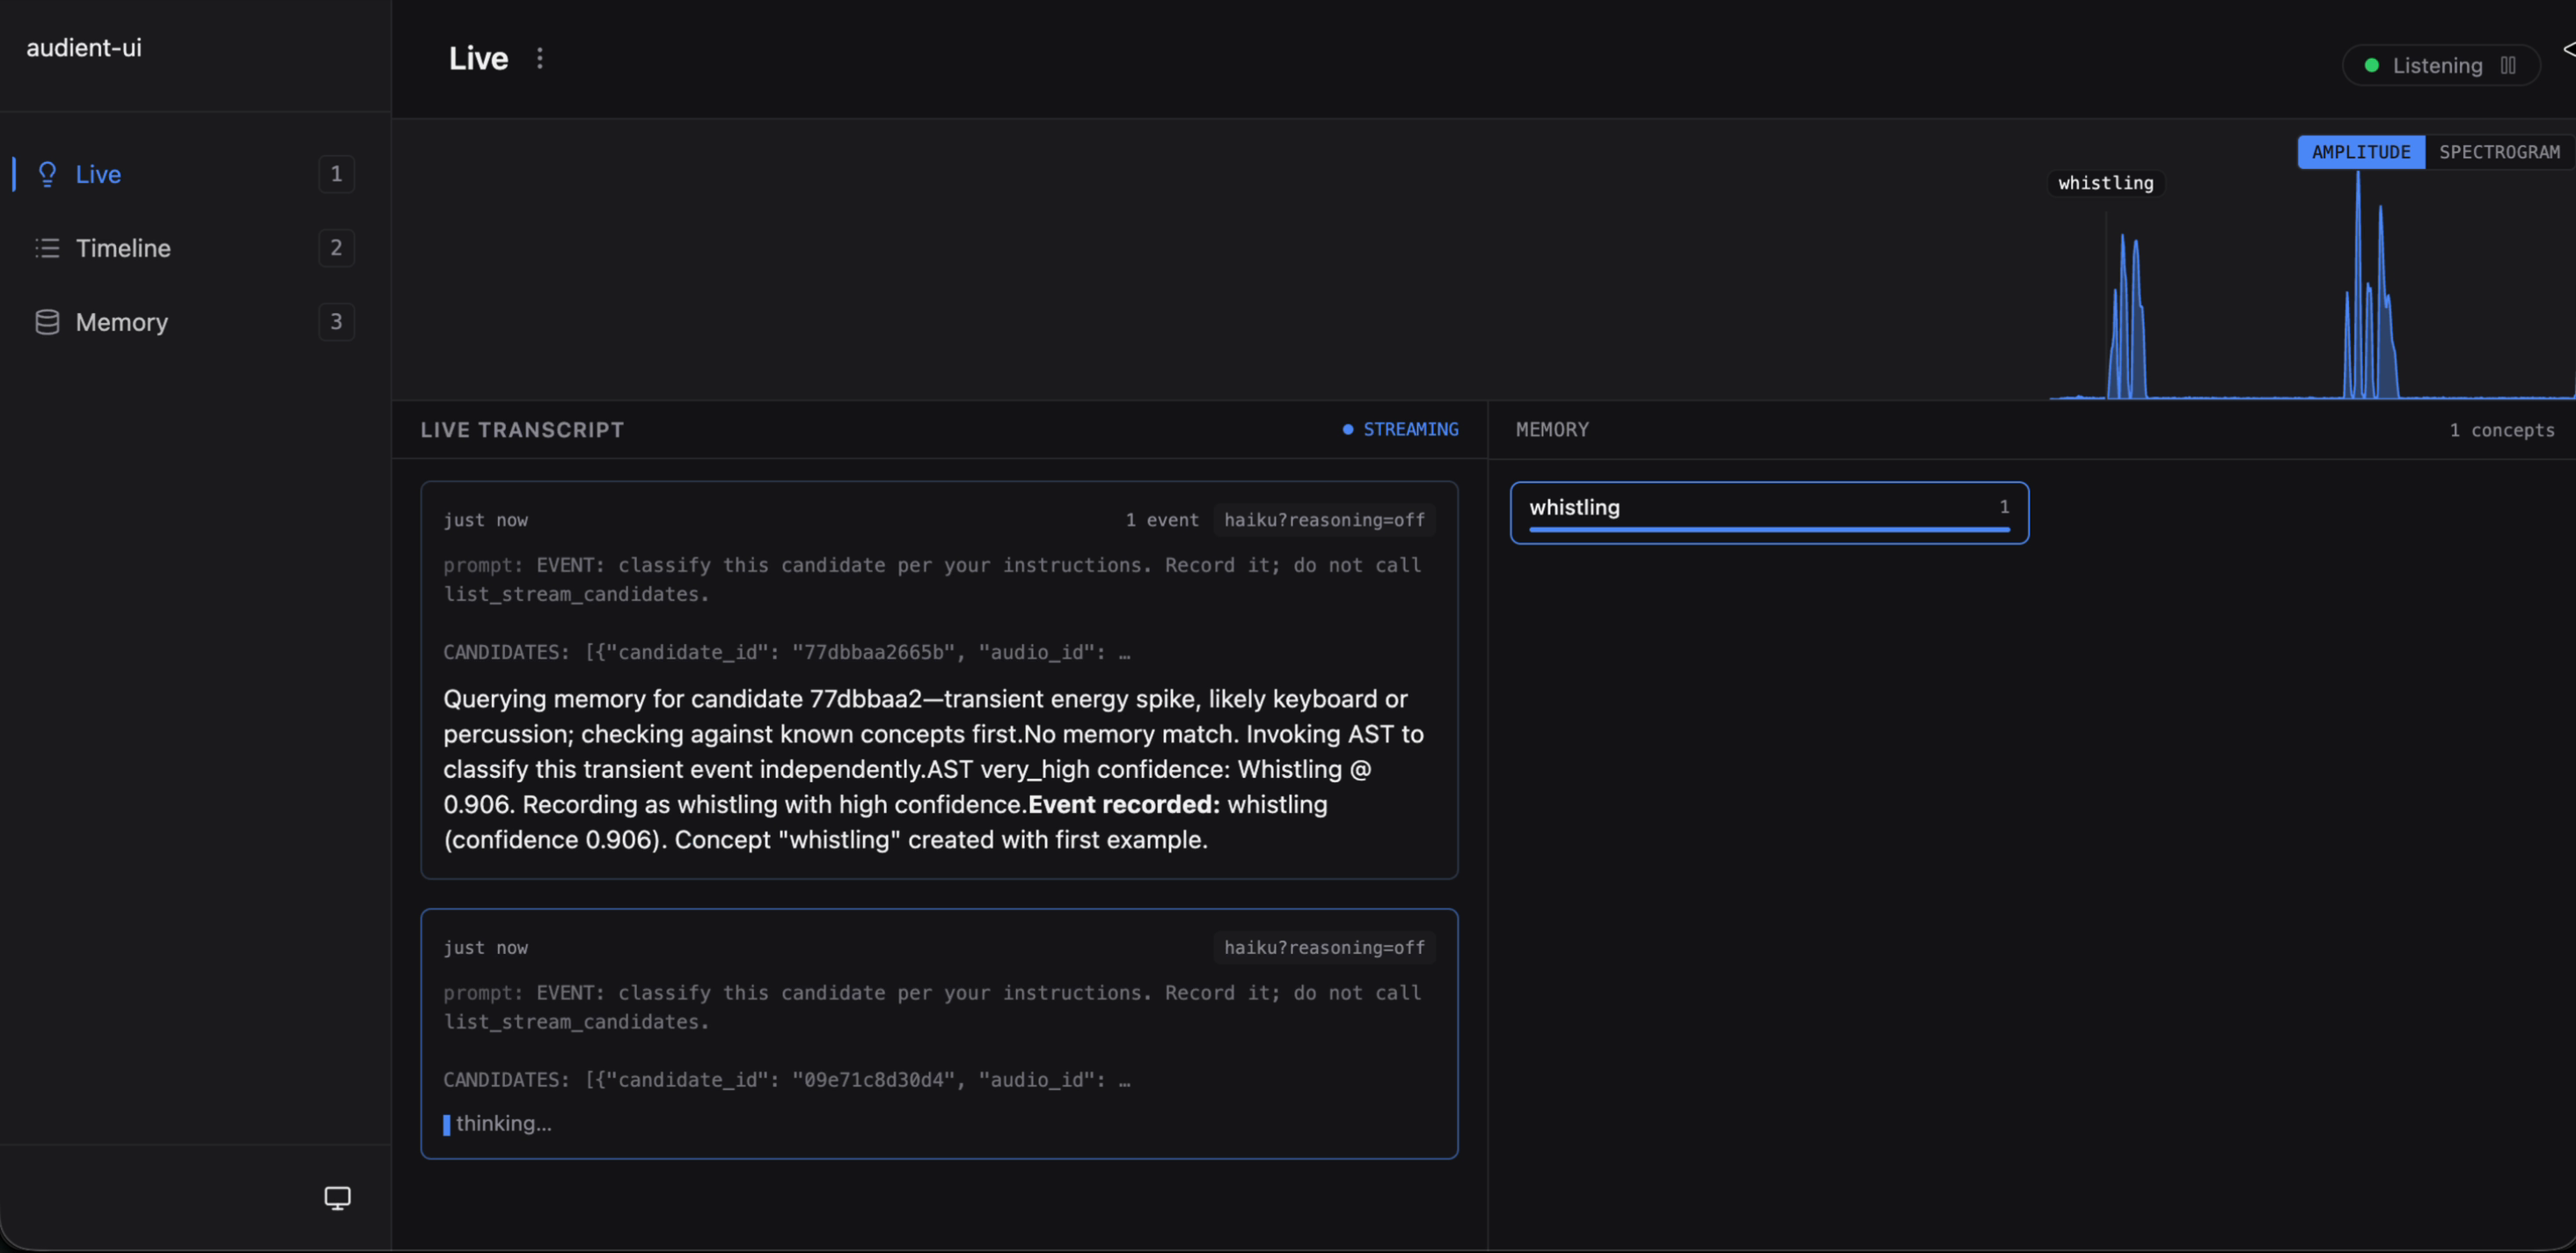
<p><strong>Step 1.</strong> Fresh run, empty store. You whistle into the mic. The gate fires. <code class="language-plaintext highlighter-rouge">query_memory</code> returns nothing — the store has never seen this sound. The agent reaches for AST as its broad-coverage fallback. AST returns <em>Whistling @ 0.906, tier=very_high</em>. Confident enough to skip the unhandled path. Agent calls <code class="language-plaintext highlighter-rouge">record_event(label="whistling", confidence=0.906)</code>. First example of a new concept.</p>

<p><img src="/assets/images/posts/audient-ears/beat1-cold.png" alt="Live surface just after the first whistle: audio scope up top with a &quot;whistling&quot; event chip, live transcript showing the classifier's turn (memory miss → AST → recorded), memory grid on the right showing &quot;whistling · 1&quot;" class="align-center" /></p>

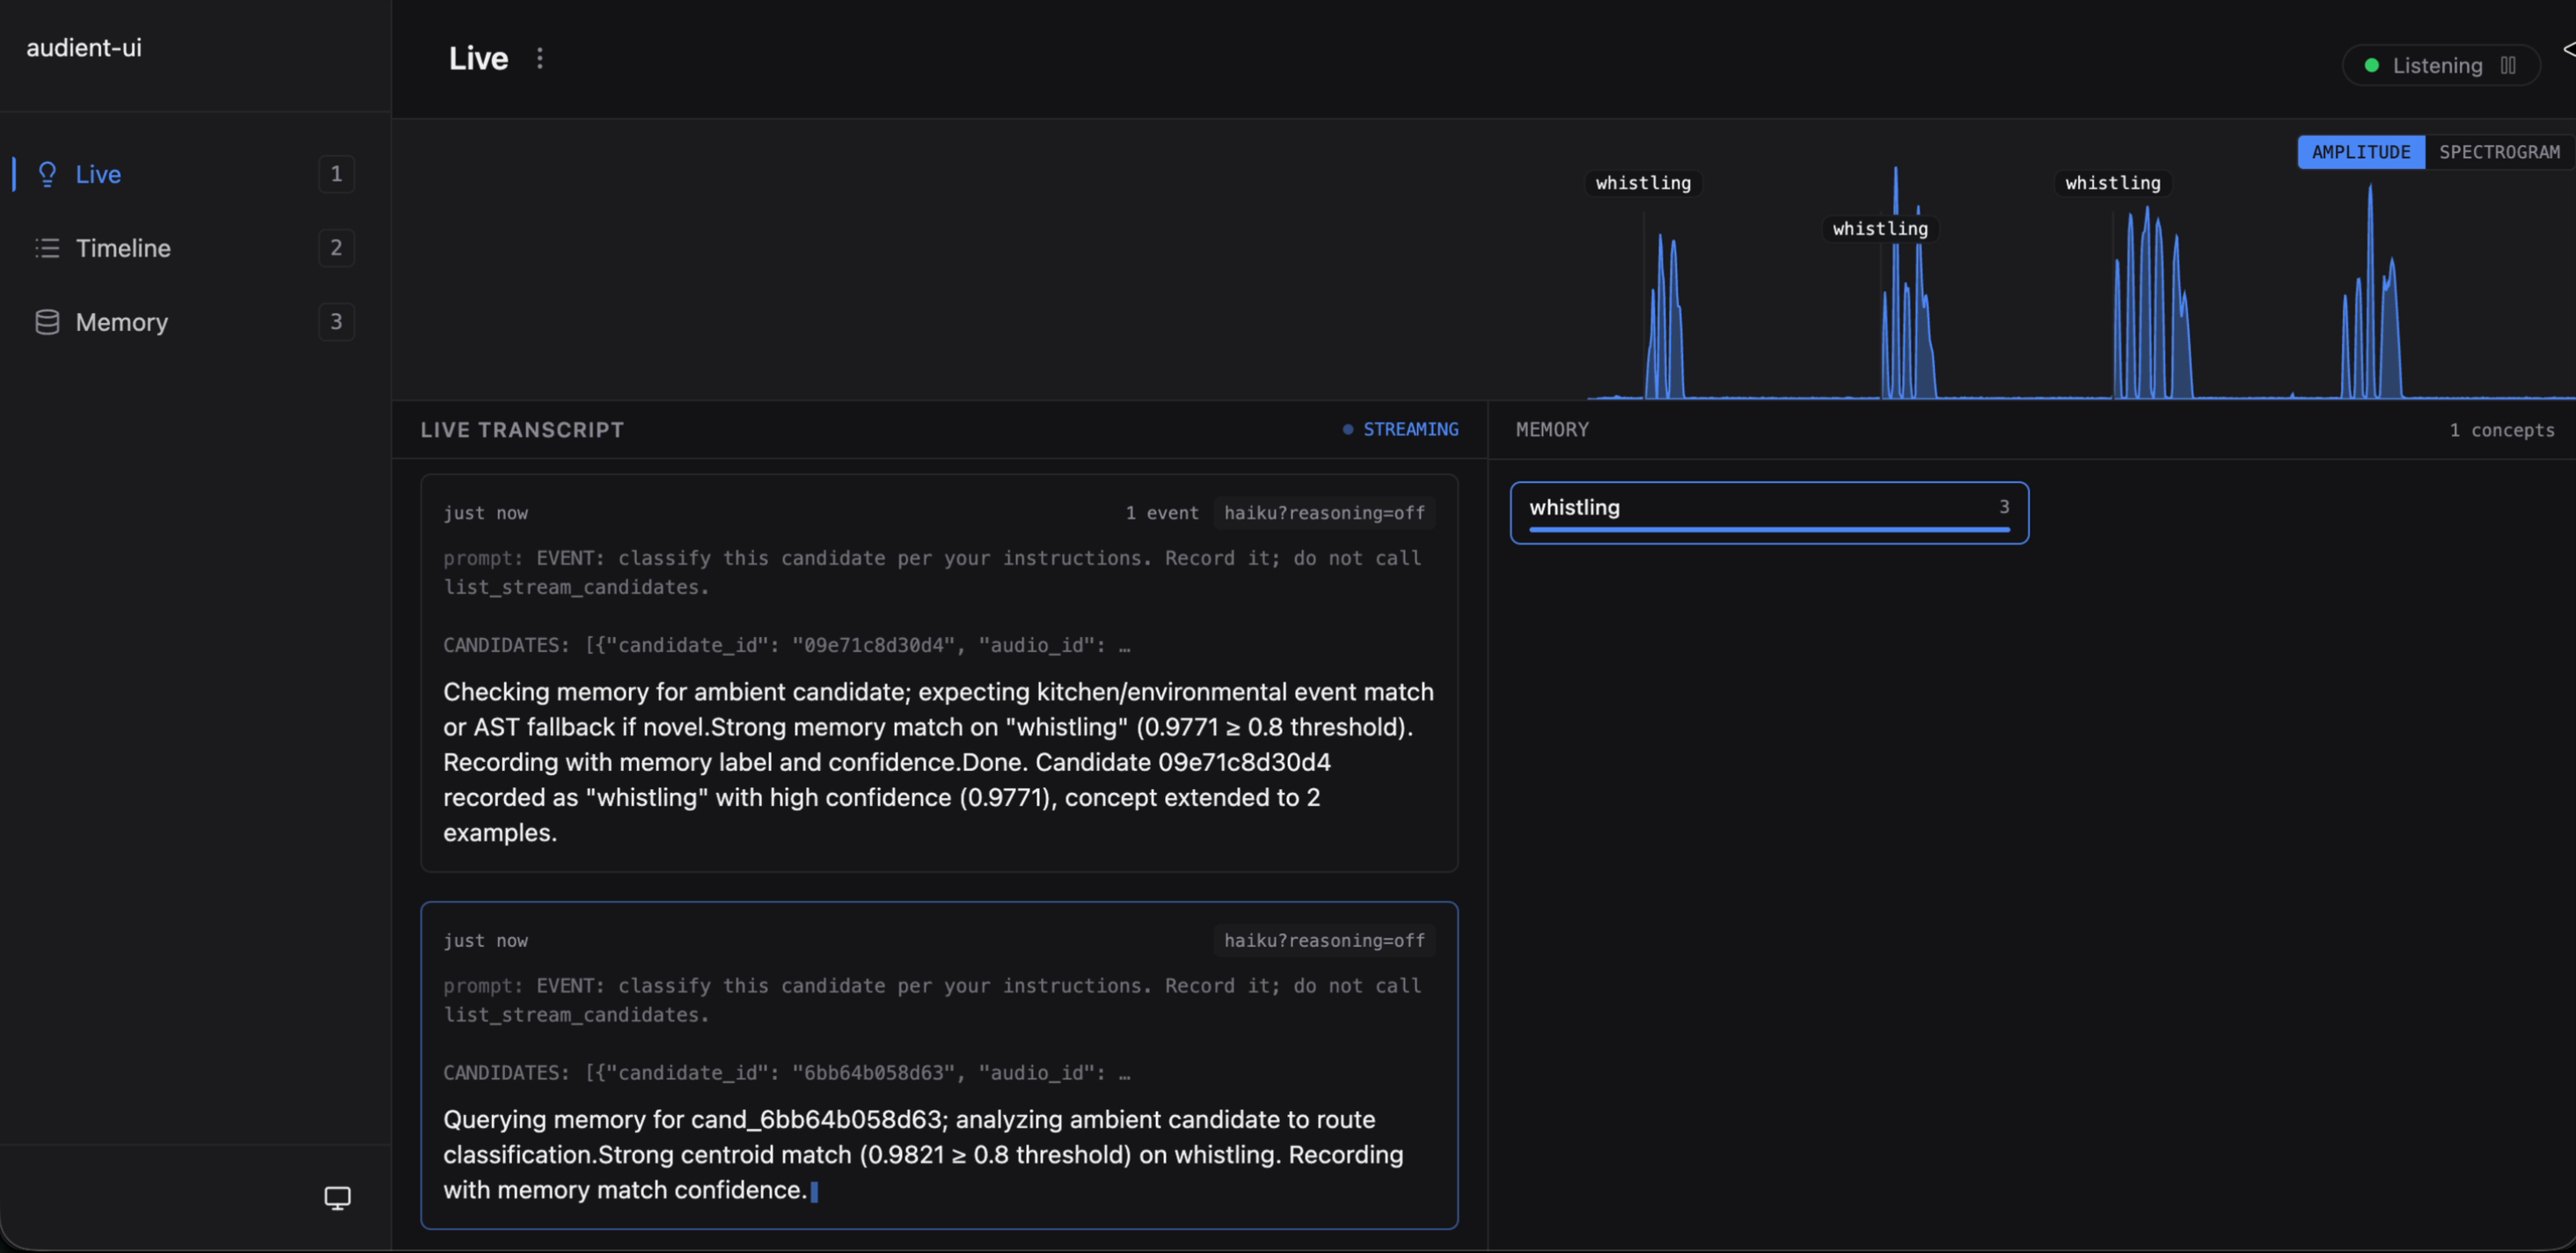
<p><strong>Step 2.</strong> You whistle again. Gate fires. <code class="language-plaintext highlighter-rouge">query_memory</code> returns <code class="language-plaintext highlighter-rouge">whistling @ 0.98</code> — well above the concept’s default 0.80 threshold. Strong match. Agent reads the score, confirms the label, records the event. The concept extends. The Memory sidebar’s counter ticks up with each whistle; the centroid tightens.</p>

<p><img src="/assets/images/posts/audient-ears/beat2-warm.png" alt="Live surface after several whistles: memory sidebar shows &quot;whistling&quot; with a rising instance count, live transcript filled with consecutive &quot;Strong memory match&quot; classifier turns" class="align-center" /></p>

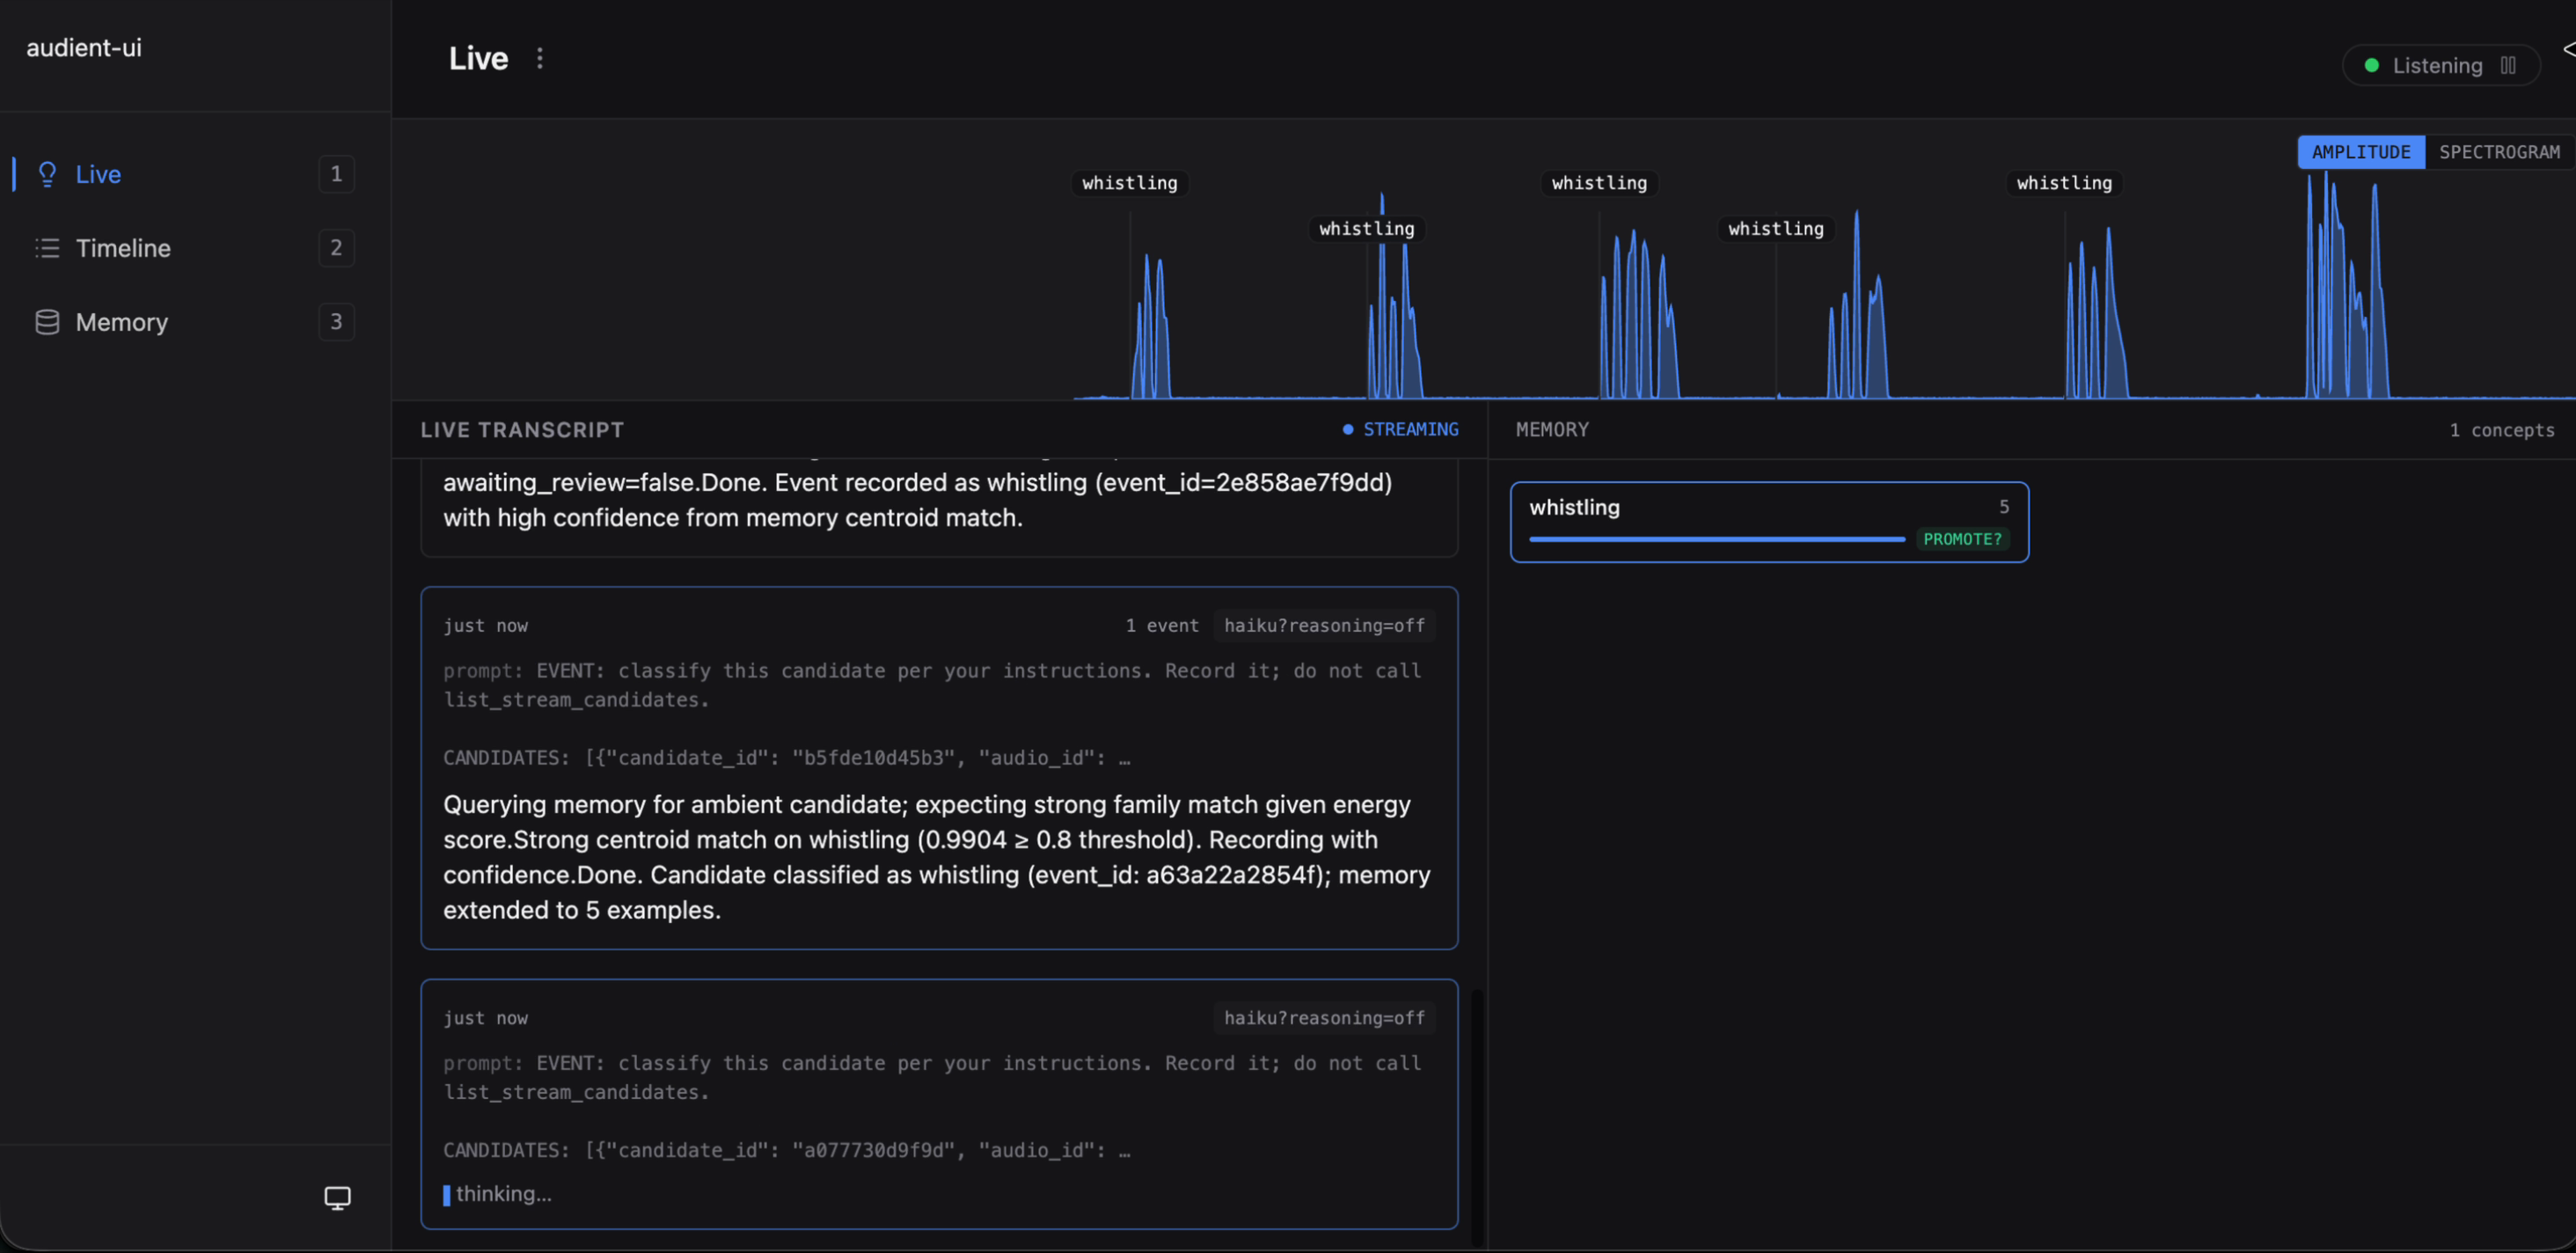
<p><strong>Step 3.</strong> After six examples, a green <strong>PROMOTE?</strong> badge lights up on the whistling concept card — audient’s hint that the concept has cleared the minimum for calibration to succeed. Click into the concept, click <strong>Promote concept</strong>. Calibration runs and picks the smallest threshold that clears 0.95 precision. Here it lands at 0.958 — high, because with only one concept in the store there’s no cross-family variance to work with; calibration has to be conservative.</p>

<p><img src="/assets/images/posts/audient-ears/beat3-ready.png" alt="Memory sidebar with the whistling concept card showing a green &quot;PROMOTE?&quot; badge on the right side" class="align-center" /></p>

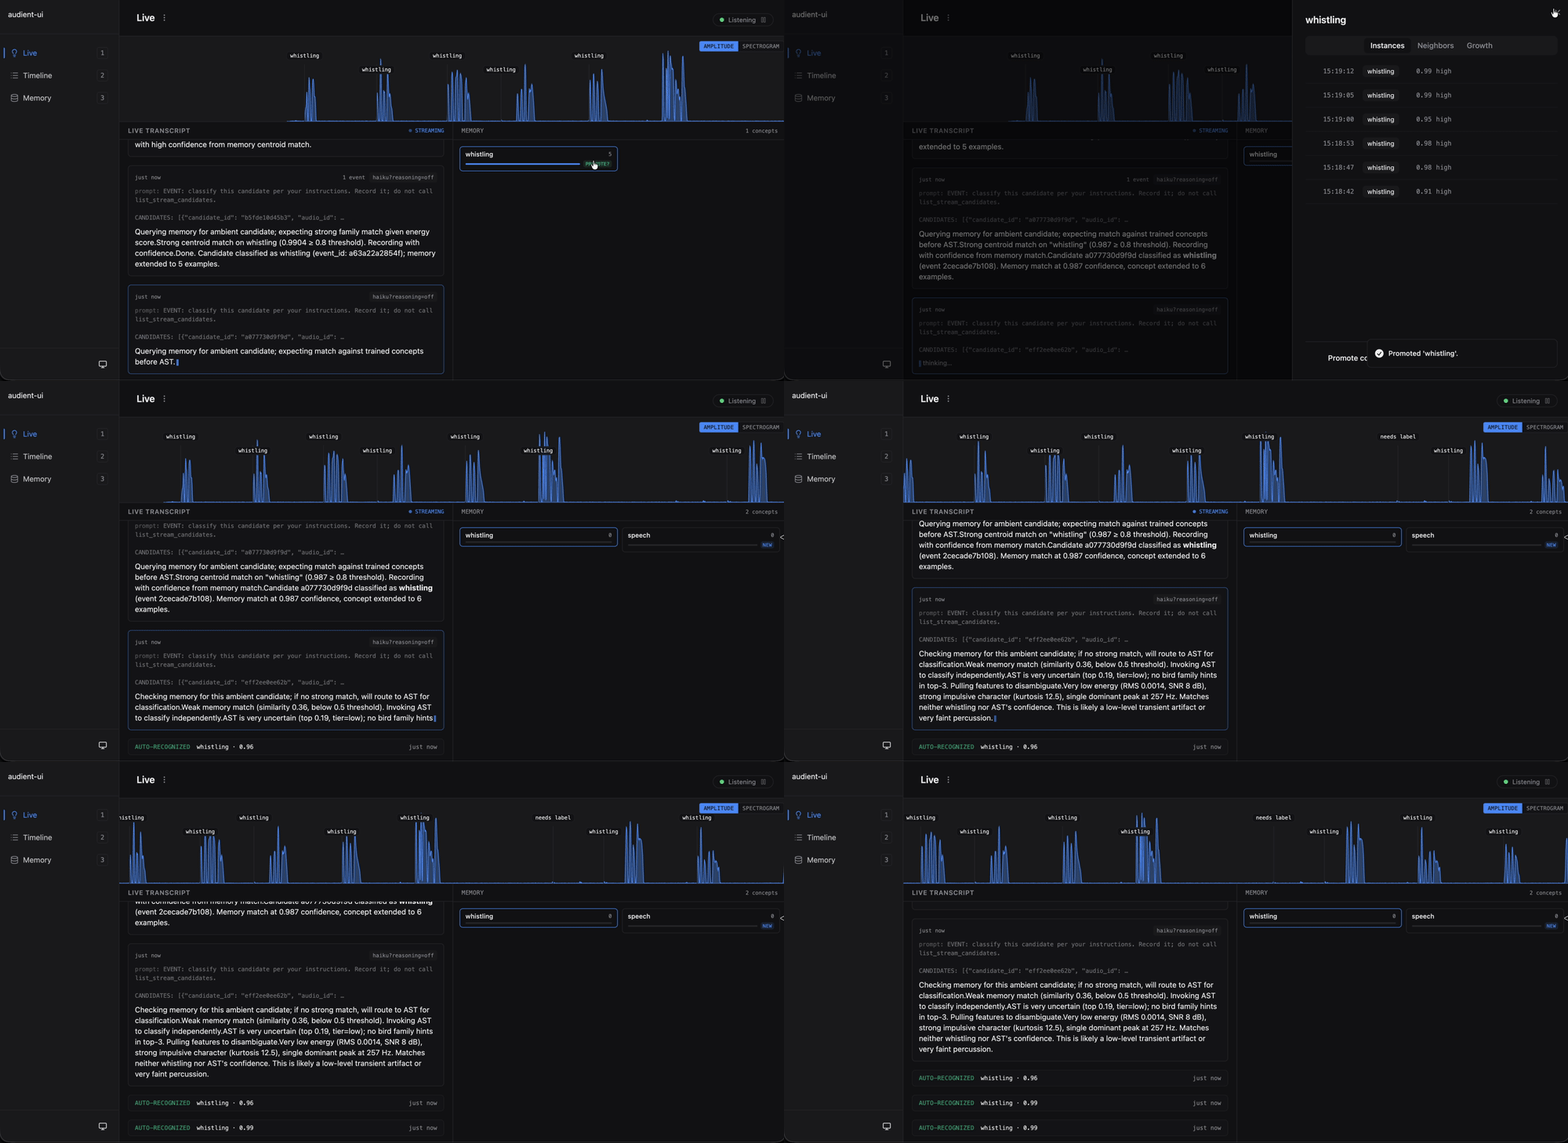
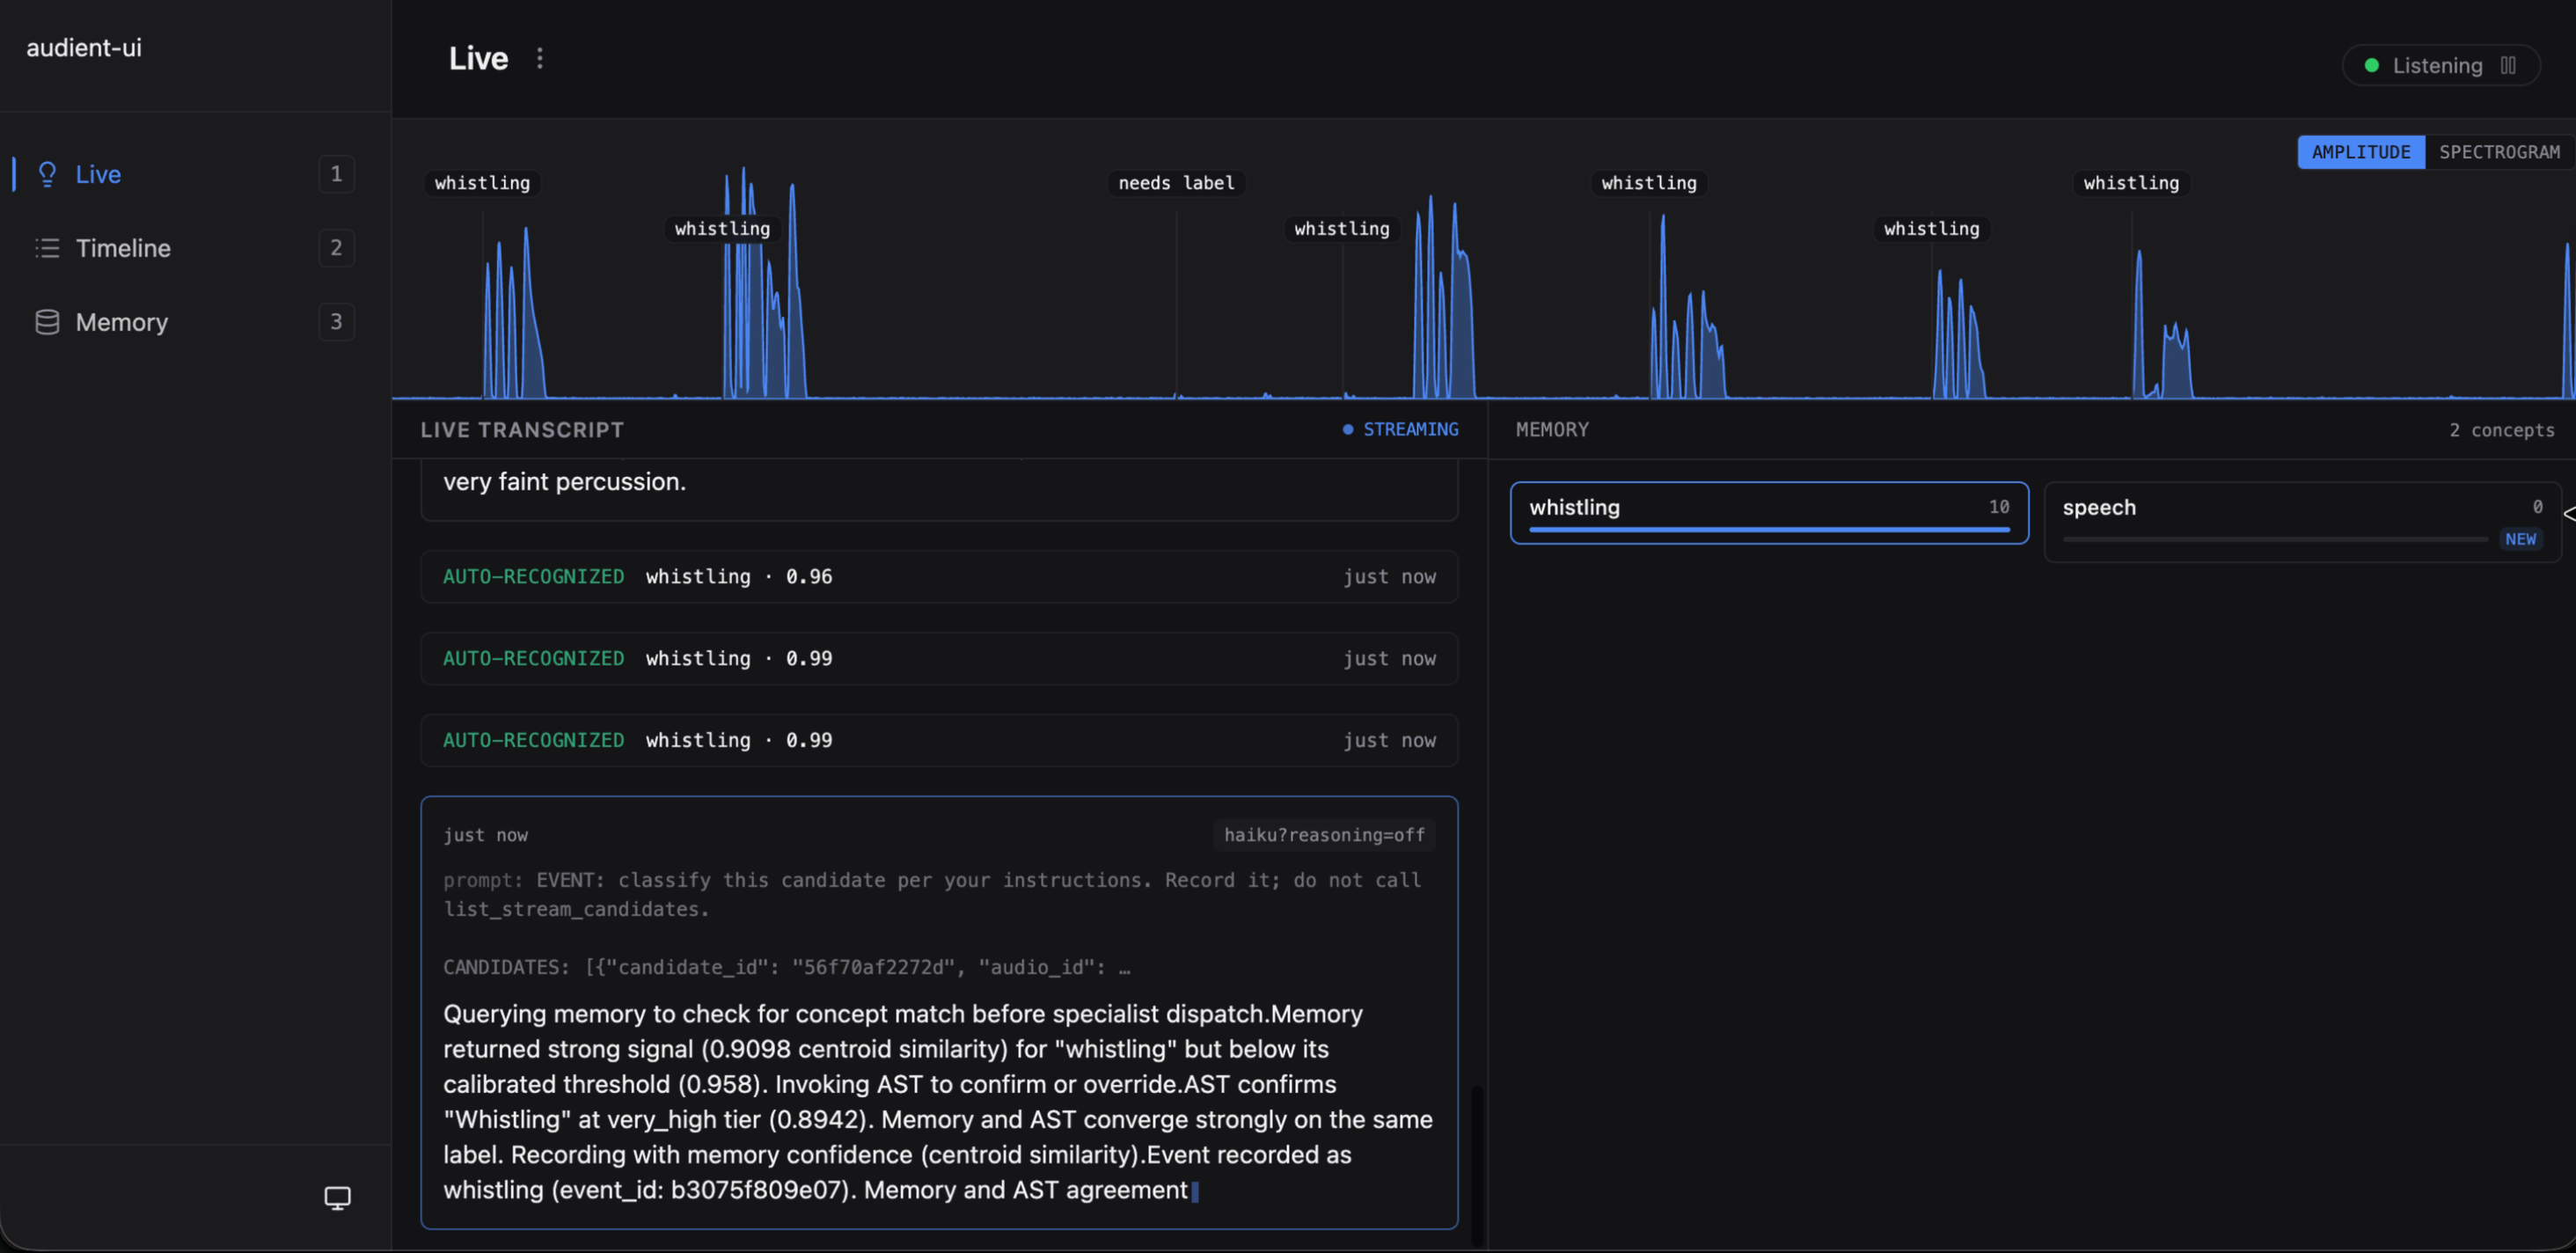
<p><strong>Step 4.</strong> From that point on, the fast path takes over. Next whistle: cosine reads 0.964, clears 0.958, and the server records it directly; no MCP round-trip, no LLM call, no reasoning turn. The Live Transcript renders a compact <code class="language-plaintext highlighter-rouge">auto-recognized · whistling · 0.99</code> row. Then another. Then another. The panel’s character changes: full classifier turns give way to slim acknowledgment rows.</p>

<p><img src="/assets/images/posts/audient-ears/beat4-pivot.gif" alt="Animated: the moment of promotion. User opens the concept detail sheet, clicks Promote, and subsequent whistles start rendering as compact auto-recognized rows instead of full classifier turns" class="align-center" /></p>

<p>Two rows worth pausing on. Mid-run, a random noise landed in the gate (an accidental tap); low energy, impulsive character, no memory match, AST tier=low. The classifier read the features, reasoned <em>faint transient or percussion</em>, and punted to unhandled. That’s the system doing what it should: a slot for “I don’t know,” and a path someone can label later.</p>

<p><img src="/assets/images/posts/audient-ears/bonus-unhandled.png" alt="Live transcript showing the classifier's reasoning through the unhandled event: weak memory match, low AST confidence, feature analysis concluding &quot;likely a low-level transient artifact or very faint percussion&quot;" class="align-center" /></p>

<p>A weaker whistle came in at 0.910: above the default 0.80 but below the calibrated 0.958. The fast path bailed. The classifier picked it up, queried memory (0.910 centroid), asked AST for a second opinion, saw both converge on whistling, and recorded it. Even after promotion, the LLM is still there for the edge cases.</p>

<p><img src="/assets/images/posts/audient-ears/bonus-borderline.png" alt="Live transcript showing a full classifier turn (borderline memory match, AST re-confirmation, recorded) sandwiched between compact auto-recognized rows" class="align-center" /></p>

<p>The LLM’s role shrinks each beat: from doing all the work, to confirming memory’s guess, to nothing at all, except on the events where it should be there. <strong>No model was trained.</strong> The “model” is a centroid in a vector store, a name attached to it, and a calibrated threshold. The expensive ML work is what CLAP, AST, and BirdNET already did. The rest is bookkeeping.</p>

<hr />

<h2 id="getting-started">Getting started</h2>

<p>Setup instructions are in the <a href="https://github.com/es617/audient#readme">README</a>. Two ways to use it: through the browser viewer that ships with audient, or through Claude Code (or any MCP-capable host) that talks to the same server. Both hit the same SQLite concept memory.</p>

<h3 id="the-browser-viewer">The browser viewer</h3>

<p>Three surfaces on the same data.</p>

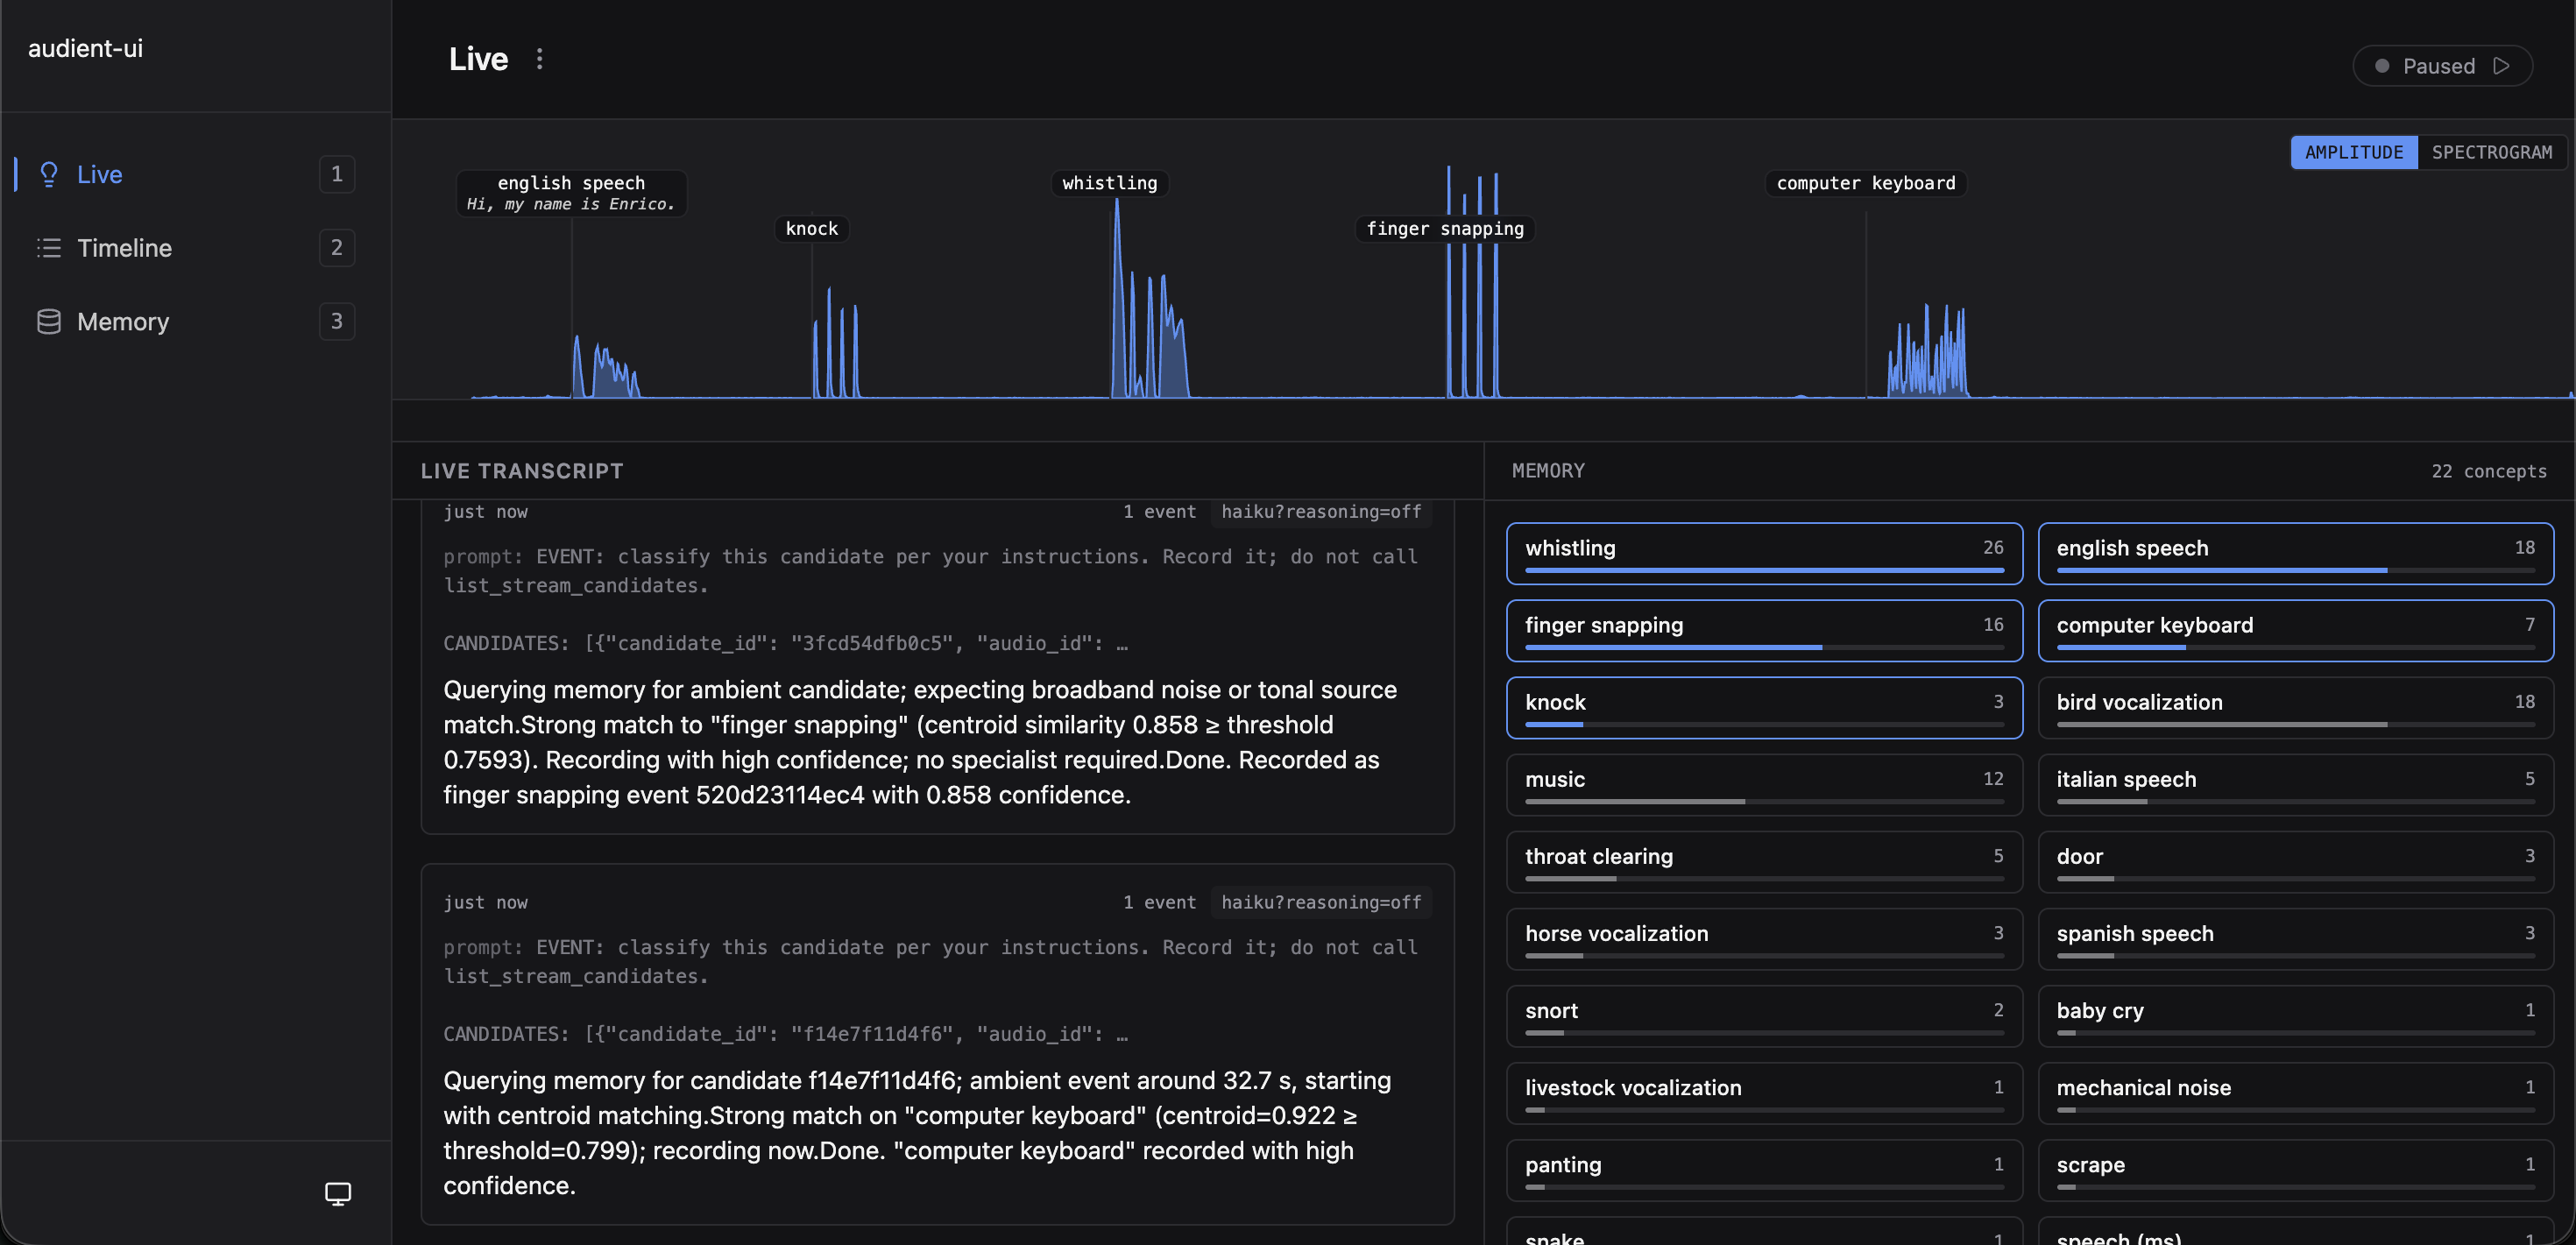
<p><strong>Live.</strong> What’s happening right now. Continuous audio scope, event chips dropping in as the gate fires, the classifier’s reasoning in a side panel, the memory grid pulsing when a concept extends.</p>

<p><img src="/assets/images/posts/audient-ears/live.png" alt="audient Live surface: audio scope on top with labeled event chips (english speech, knock, whistling, finger snapping, computer keyboard), a Live Transcript panel streaming classifier reasoning, and the Memory grid on the right" class="align-center" /></p>

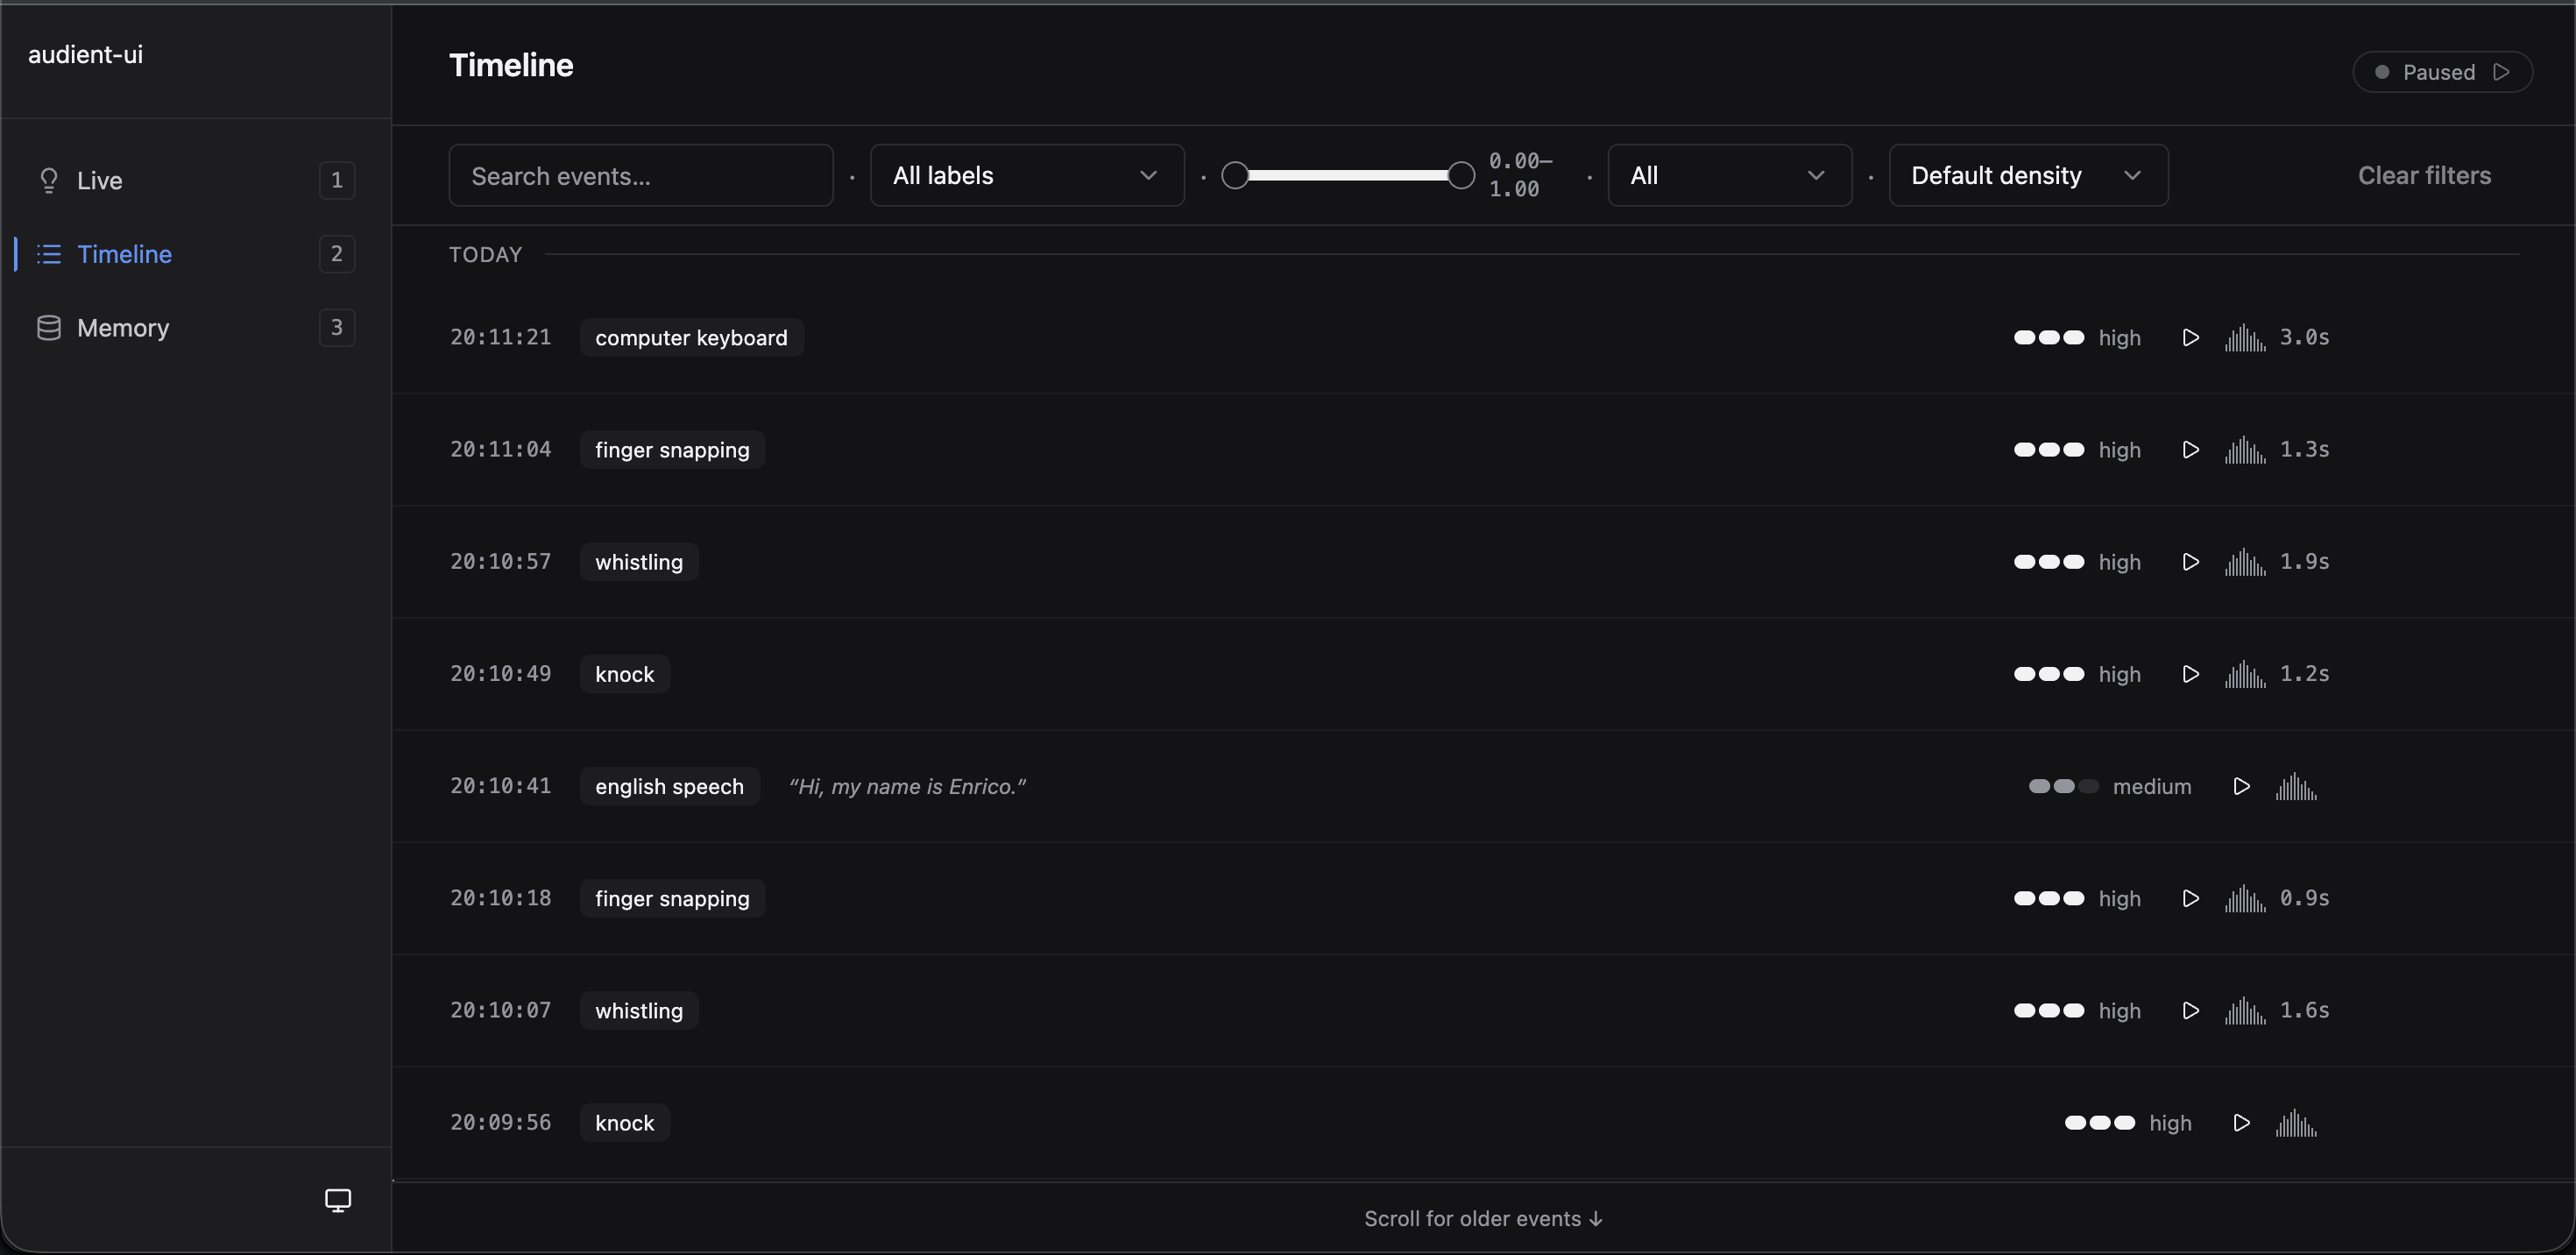
<p><strong>Timeline.</strong> What happened. Chronological events, playable, with the label, confidence, and which recognizer decided.</p>

<p><img src="/assets/images/posts/audient-ears/timeline.png" alt="audient Timeline surface: chronological list of events with timestamps, labels (computer keyboard, finger snapping, whistling, knock, english speech), confidence badges (high / medium), playback buttons, and duration" class="align-center" /></p>

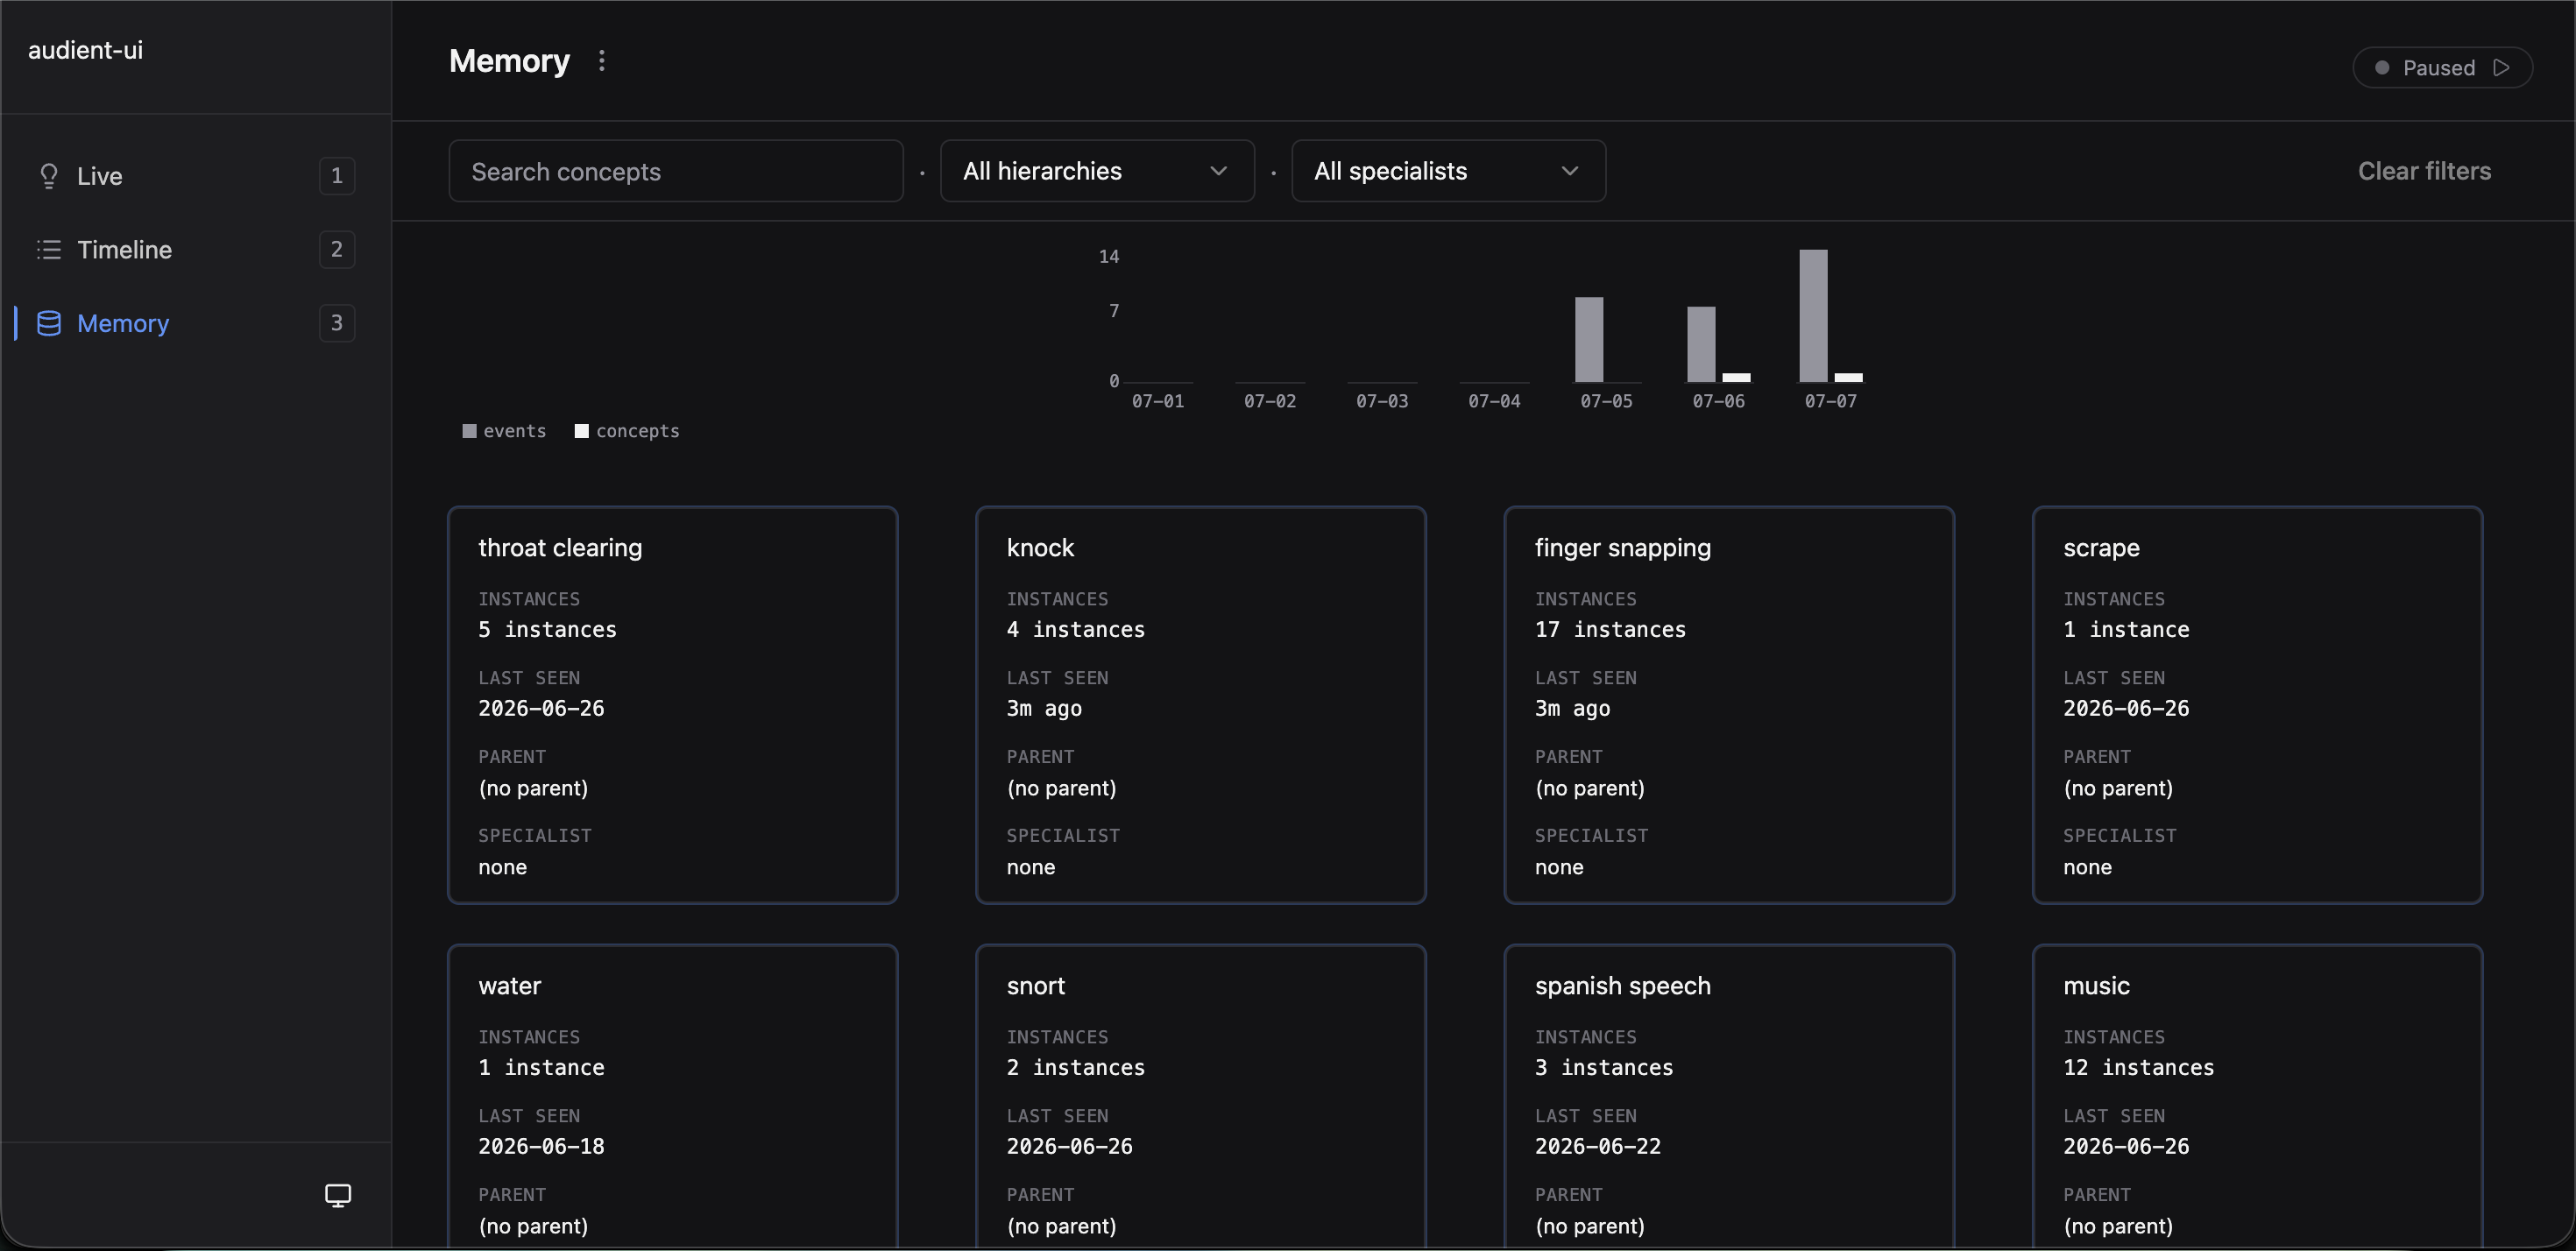
<p><strong>Memory.</strong> What the agent has learned. Concepts in the store, their examples, how their centroids have moved over time, when they were taught.</p>

<p><img src="/assets/images/posts/audient-ears/memory.png" alt="audient Memory surface: growth histogram at the top showing events and concepts per day, and a grid of concept cards below (throat clearing, knock, finger snapping, scrape, water, snort, spanish speech, music) each showing instance count, last seen, parent, and specialist" class="align-center" /></p>

<h3 id="from-claude-code">From Claude Code</h3>

<p>The default entry point speaks stdio MCP. Point your client at the <code class="language-plaintext highlighter-rouge">audient</code> command in the server directory and you get the tool surface.</p>

<blockquote>
  <p>Note: Claude Code doesn’t listen for MCP push notifications, so it’s more of a pull-based approach.</p>
</blockquote>

<hr />

<h2 id="known-limitations">Known limitations</h2>

<p>audient is experimental. It’s been lightly evaluated on recorded data during development; no formal benchmark suite or public-dataset numbers yet.</p>

<p><strong>Single-source assumption.</strong> Each detected region is treated as one event. Overlapping sounds — a bird call over music, a doorbell mid-conversation — get classified as whichever signal dominates. The other is lost. Source separation isn’t wired up.</p>

<p><strong>macOS-first.</strong> Everything has been tested on macOS. The dependencies (torch, transformers, faster-whisper, sounddevice/portaudio) all have Linux wheels, so Linux should work with minimal fuss; I just haven’t verified. Windows needs a Windows branch added to the BirdNET dep gate in <code class="language-plaintext highlighter-rouge">pyproject.toml</code> and probably a look at the mic-source path; nothing about the models themselves is Windows-incompatible.</p>

<p><strong>Prompt tuned for Anthropic.</strong> The classifier runs through <a href="https://github.com/Evalstate/fast-agent">fast-agent</a> so any supported provider (Anthropic, OpenAI, Gemini, local via Ollama) will run, but the prompt was written and tested against Anthropic models. Switching may need prompt adjustments.</p>

<hr />

<h2 id="open-directions">Open directions</h2>

<p>A few directions from here:</p>

<ul>
  <li><strong>Agent-grown specialists.</strong> The registry doesn’t have to be hand-curated. The agent could discover them (searching <a href="https://huggingface.co/">Hugging Face</a> for a pretrained model that fits a concept it’s struggling with and registering it on the fly) or train them from the store itself: a small learned classifier over the CLAP embeddings the store already has, a family disambiguator, a speaker-ID head.</li>
  <li><strong>Per-subclass concept splitting.</strong> Concepts live at the family level today: “bird vocalization” holds examples across species, with the species as <code class="language-plaintext highlighter-rouge">subclass</code> metadata per event. When variance under a family is high, the store could promote subclasses to leaf concepts under the family root.</li>
  <li><strong>Voice beyond words.</strong> Speech goes to Whisper for transcript only. Tone, emotion, speaker identity, prosody, stress; the architecture supports adding these as specialists under the “speech” concept, each declaring its own contract; none exist today.</li>
  <li><strong>Cross-modal teaching.</strong> The unhandled bucket assumes a human teacher. Pair it with a vision channel and the system labels its own audio by looking: hear the crash, turn the camera, see the broken glass, label the sound.</li>
  <li><strong>Spatial awareness.</strong> A mic array and beamforming give events a <em>where</em>: <em>baby crying, back of the room</em>; <em>glass break, kitchen</em>. Pairs naturally with vision-pointing.</li>
</ul>

<hr />

<h2 id="closing-thought">Closing thought</h2>

<p>The series has been about giving agents direct, stateful access to interfaces that used to require humans: BLE, serial, debug probes. Hands.</p>

<p>Ears are different. There’s no protocol to wrap. The problem is a vocabulary problem: how do you build a working map of what your environment sounds like, without one to start from? The answer ends up looking a lot like what a brain does.</p>

<hr />

<h2 id="links">Links</h2>

<ul>
  <li><a href="https://github.com/es617/audient">audient on GitHub</a></li>
  <li><a href="/let-the-ai-out/">Let the AI Out series</a></li>
</ul>]]></content><author><name>Enrico Santagati</name></author><category term="mcp" /><category term="agents" /><category term="audio" /><category term="perception" /><category term="llm" /><category term="clap" /><category term="embeddings" /><category term="learning" /><category term="ambient" /><summary type="html"><![CDATA[An audio perception layer for AI agents: hear a sound, recognize it if familiar, learn it if not.]]></summary></entry><entry><title type="html">My Second Brain Was Everywhere. My AI Couldn’t Get In.</title><link href="https://es617.dev/2026/06/26/obsidian-vault-mcp.html" rel="alternate" type="text/html" title="My Second Brain Was Everywhere. My AI Couldn’t Get In." /><published>2026-06-26T00:00:00+00:00</published><updated>2026-06-26T00:00:00+00:00</updated><id>https://es617.dev/2026/06/26/obsidian-vault-mcp</id><content type="html" xml:base="https://es617.dev/2026/06/26/obsidian-vault-mcp.html"><![CDATA[<hr />

<p>Obsidian didn’t win on features. It won as a <em>second brain</em>: the place your thinking accumulates and stays yours, in plain files you control. And it’s already everywhere I am. Obsidian Sync, or iCloud, or a self-hosted setup keeps the vault mirrored across my laptop, my desktop, my phone. As a place to read and write my own notes, the reach problem was solved years ago.</p>

<p>What changed is how I use it. A second brain used to be a one-way dump. A thought shows up, I drop it into my notes raw, promise to tidy it later, never do. The notes fills with fragments I have to clean up before they’re worth anything. Now the thought goes to Claude first. I think it through in the conversation, the agent helps me sharpen it, and the version that reaches the notes is already clean. The AI slid in between me and my notes and became the way I write to them. I don’t dump into my second brain anymore. I dump into Claude, and Claude files the refined result.</p>

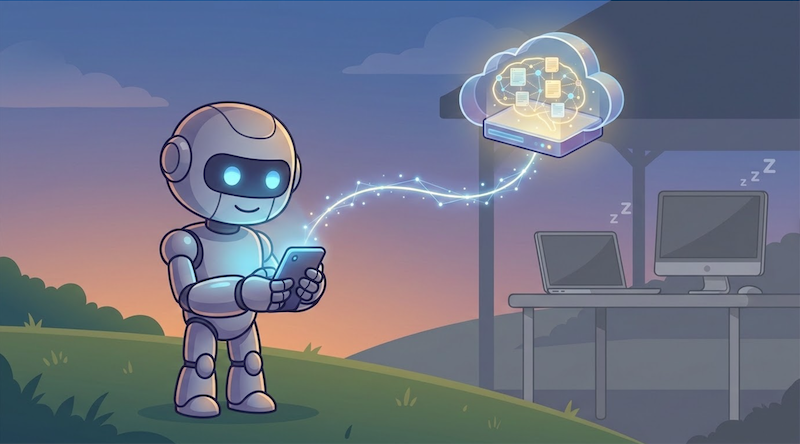
<p><img src="/assets/images/posts/obsidian-vault-mcp/hero.png" alt="Away from the machine, an AI reaches a vault that lives in the cloud while your other devices sleep" class="align-center" /></p>

<p>At my desk this mostly works. The vault files sit right there on disk, and you can wire a local tool to read them. But that’s not where the thinking happens. The ideas show up when I’m away from the machine: walking somewhere, on a train, halfway through a book. In those moments Claude is on my phone and my whole vault is synced to the same phone, two apps an inch apart, and they have no way to reach across to each other.</p>

<p>So I went looking for a way to give the AI access from anywhere I am. There were a couple of options, but all came down to the same deal: leave your laptop always-on. That works, technically. It also makes your second brain hostage to whether you remembered to leave a computer on. I wanted it to work with every device off. Nothing did. So I built it a few months ago, and I’ve used it every day since.</p>

<h2 id="why-the-ai-couldnt-get-in">Why the AI couldn’t get in</h2>

<p>The sync tools all keep your vault for <em>you</em>. They move notes between your own devices and stop there. None of them is something an outside agent can read from.</p>

<p>Obsidian Sync is a closed, end-to-end pipe between copies of Obsidian. There’s no API to reach into it from anywhere else. iCloud is a file-sync layer between your Apple devices; Claude on the web has no path into it at all. The Local REST API plugin does expose an HTTP endpoint, but only while Obsidian is running, on a machine that’s awake and reachable. Every option is either a sealed box or needs a device of mine on.</p>

<p><a href="https://github.com/vrtmrz/obsidian-livesync">Self-hosted LiveSync</a> is the exception, and the reason is that it’s open source. The community plugin, 600k+ downloads, syncs your vault into a CouchDB database that <em>you</em> own and control, in a documented format that its own <a href="https://github.com/vrtmrz/livesync-commonlib">shared library</a> can read and write. That’s not a sealed pipe. It’s a database with a door. And because the database is yours, you decide where it runs: locally on your own machine if that’s all you need, or on any always-on host you point it at, including a <a href="https://fly.io">Fly.io</a> box that costs close to nothing. Put it somewhere that stays up and your notes are reachable no matter which of your devices are asleep, chunked and end-to-end encrypted. Everything an agent would need was sitting in place. The one missing piece was the thing that lets the agent in.</p>

<h2 id="the-build">The build</h2>

<p><a href="https://github.com/es617/obsidian-sync-mcp">Obsidian Sync MCP</a> gives any AI agent read and write access to your vault. It runs in one of two modes.</p>

<p>Filesystem mode reads <code class="language-plaintext highlighter-rouge">.md</code> files straight from the vault folder. Simple, no database, but the machine has to be on. CouchDB mode reads and writes the database that LiveSync syncs to, which is what lets the vault answer with every one of your devices off.</p>

<p>CouchDB mode is the one that fixed my problem, and it’s the harder one to get right. LiveSync doesn’t store plain Markdown. It stores documents split into content-addressed chunks, optionally encrypted, optionally with obfuscated file paths. To read or write a note that the plugin will accept, you have to speak that format exactly. Rather than reverse-engineer it, the server imports <a href="https://github.com/vrtmrz/livesync-commonlib">livesync-commonlib</a>, the same library that powers the plugin. What the MCP server writes, the plugin reads, because underneath they’re running the same code.</p>

<p>Both modes expose the same MCP tools over HTTP, so any MCP-compatible agent connects: Claude on desktop, web, or mobile, Copilot, custom agents, anything that speaks the protocol.</p>

<div class="mermaid">
%%{init: {'theme': 'dark', 'themeVariables': {'edgeLabelBackground': 'transparent'}}}%%
graph LR
    PHONE["📱 Claude<br /> (phone)"] --&gt;|"MCP / HTTP"| MCP["⚙️ obsidian-sync-mcp"]
    MCP --&gt;|"read / write<br />chunks + E2EE"| DB["☁️ CouchDB"]
    LAPTOP["💤 Laptop<br /> (asleep)"] -.-&gt;|"LiveSync<br />when awake"| DB
    subgraph cloud ["Always-on server"]
        MCP
        DB
    end
    style PHONE fill:#2d1b69,stroke:#b794f4,stroke-width:2px,color:#fff
    style MCP fill:#4a1942,stroke:#f687b3,stroke-width:2px,color:#fff
    style DB fill:#1a365d,stroke:#63b3ed,stroke-width:2px,color:#fff
    style LAPTOP fill:#2a2a2a,stroke:#666,stroke-width:1px,color:#888
</div>

<p>I run mine on Fly.io, the MCP server and CouchDB sharing one small box. It’s less than $5/month, which Fly.io doesn’t collect as of today. Getting there is one command: a setup script that deploys either the MCP server on its own, next to a CouchDB you already have, or CouchDB and the MCP server together from scratch. It generates the credentials and wires them up as it goes, so the whole thing is a few prompts rather than an afternoon of config.</p>

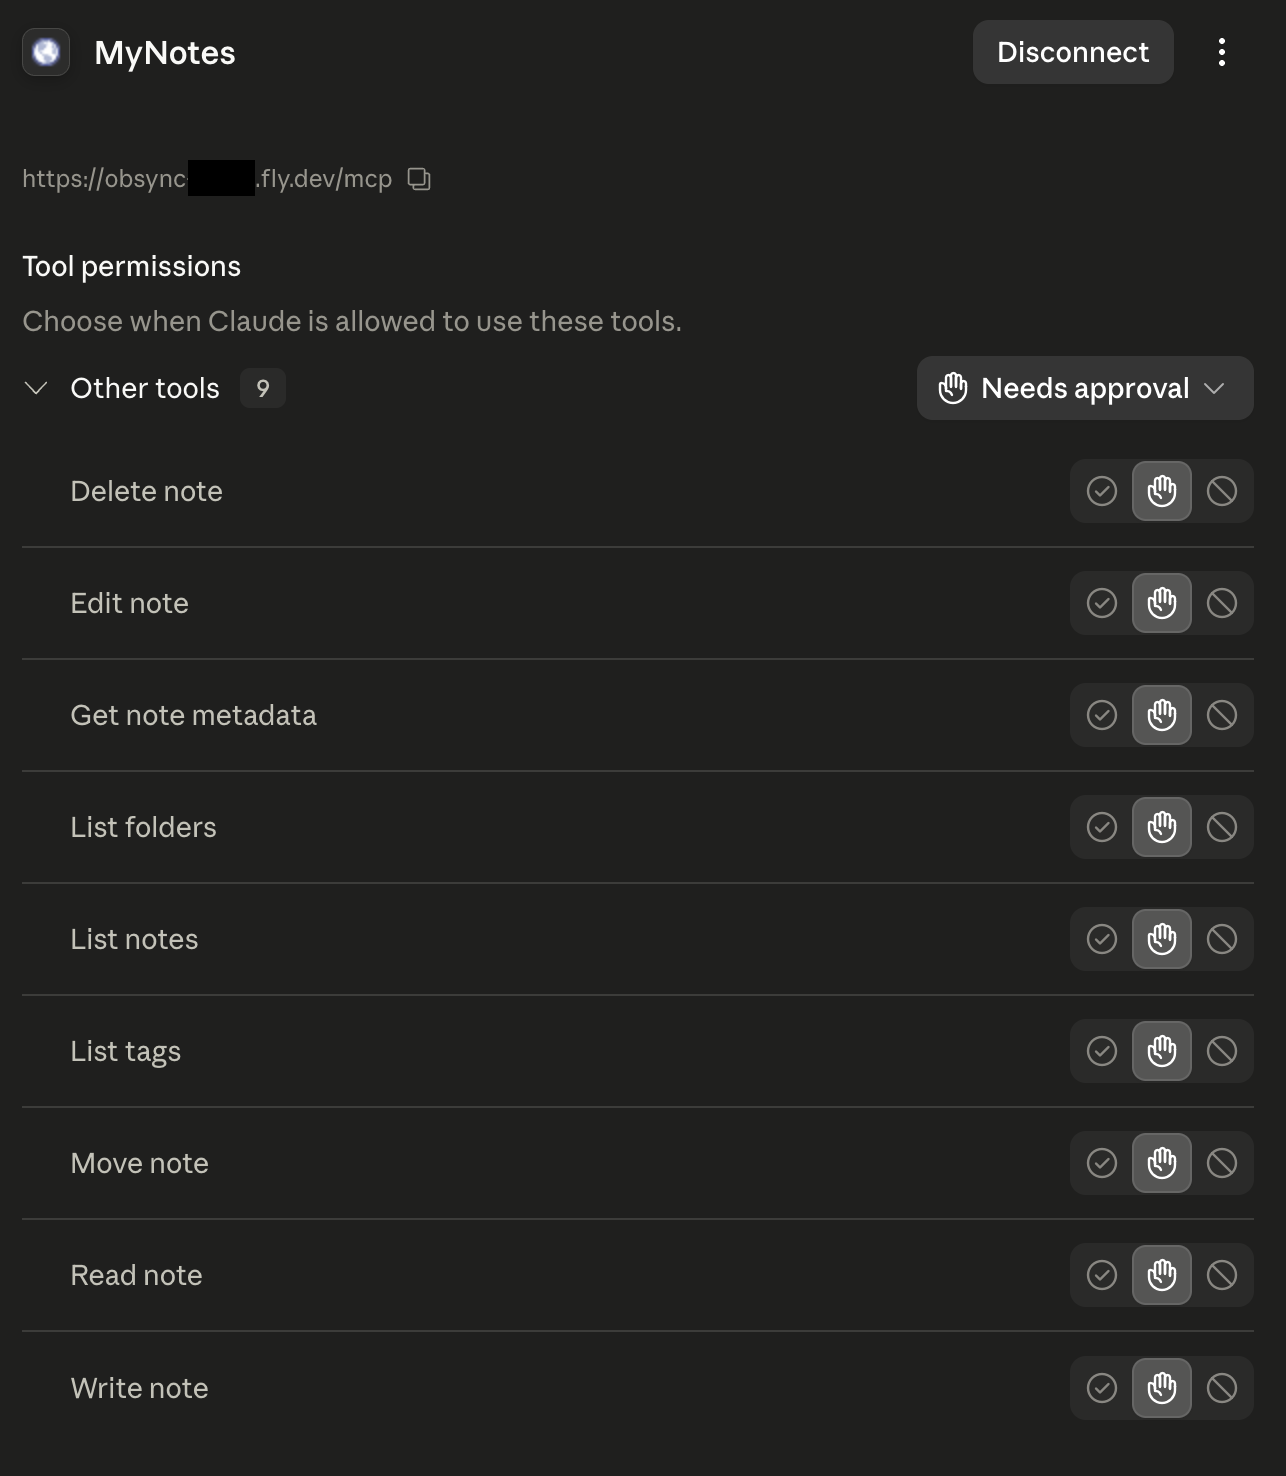
<p>Once it’s connected, the agent sees the vault as a set of tools.</p>

<p><img src="/assets/images/posts/obsidian-vault-mcp/tool-permissions.png" alt="The Obsidian Sync MCP tools connected to Claude, each set to require approval" class="align-center" /></p>

<p>That “needs approval” column matters: every read and every write waits for me to say yes. It’s the first line of defense for handing an agent the keys to your notes.</p>

<h2 id="how-i-actually-use-it">How I actually use it</h2>

<p>Most days it starts on my phone. A half-formed thought goes into the chat while it’s still fresh, the agent and I knock it into shape, and only the cleaned-up version gets written to a note. The messy thinking stays in the conversation. The vault gets the result, waiting in Obsidian the next time I open the laptop, which never had to be on for any of it.</p>

<p>The same move works for anything worth keeping. A technical back-and-forth, a debugging session, a decision I argued myself through: instead of letting it scroll out of a chat window forever, I have the agent write it into a note in a clean, readable format. That quietly turns the vault into shared memory between agents. A thread I had with Claude on the web becomes context I can hand to Claude in VS Code, not by replaying the session but by pointing the next agent at the note. <a href="/2026/04/15/cc-tap.html">cc-tap</a> bridges live sessions; this is the structural version, where the durable artifact does the handoff and survives every session that touched it.</p>

<p>Books are their own habit, and the richest use of all of this. I read, then I take the book to Claude. Sometimes it’s just a quote worth keeping. More often it turns into a real conversation: a thread I want to pull on, a concept I dig into until it opens onto other writers, the history underneath it, the social questions it runs into. That thinking is worth more than the highlights, so the whole thread gets distilled into notes and tagged as I go. Months later I can ask what I took from a given author, or where a particular idea led me, and it’s there, in their words and mine.</p>

<p>And I stopped doing the bookkeeping. The agent picks the tags and wires up the <code class="language-plaintext highlighter-rouge">[[links]]</code>, so notes connect to each other without me stopping to think about taxonomy. Tagging and linking was the part of Obsidian I always let rot, the chore that quietly kills a vault. Handing it to the agent is what finally made the graph worth having.</p>

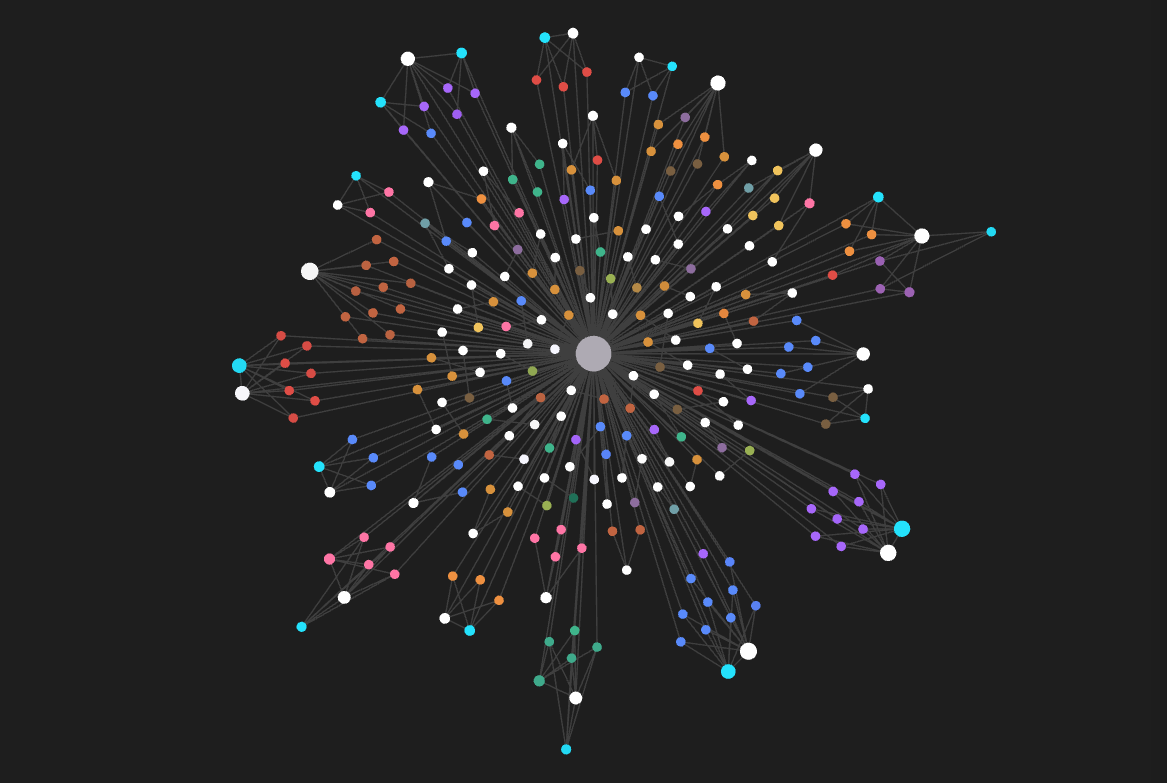
<p><img src="/assets/images/posts/obsidian-vault-mcp/reading-graph.png" alt="My Libby reading history, organized into the vault by the agent through the server: every book a note, tagged and linked into the graph" class="align-center" /></p>

<p>That graph is one example: my entire reading history from Libby, pulled in and filed by the agent through the server. Every book became a note, tagged and linked into the web, and I didn’t place a single connection by hand.</p>

<p>Two settings make me trust it with all of this. <code class="language-plaintext highlighter-rouge">MCP_INSTRUCTIONS</code> bakes my vault’s conventions into the server itself: folder structure, naming rules, where daily notes go, which tags exist. Every client follows them without per-app config, and the agent stops guessing where things belong. <code class="language-plaintext highlighter-rouge">READ_ONLY</code> exposes only the read tools, so an agent can lean on my vault as context without ever touching it. Both of those started as requests from other people using it, which was the first sign I wasn’t the only one with this gap.</p>

<h2 id="what-it-is-and-what-it-isnt">What it is, and what it isn’t</h2>

<p>It’s a tool I use every day that other people now use too. It isn’t Obsidian Sync with a support desk. A few honest edges:</p>

<ul>
  <li>CouchDB mode rides on LiveSync, which is powerful but rough around the edges. The initial setup takes some patience, and the plugin gives you a lot of knobs to get right. The saving grace is that it’s a one-time job: once it’s running, you stop thinking about it.</li>
  <li>One vault per instance. Multiple vaults means multiple servers on different ports.</li>
  <li>Last write wins. If an agent and Obsidian edit the same note at the same instant, there’s no conflict resolution yet. <a href="https://github.com/es617/obsidian-sync-mcp/issues/2">Issue #2</a> tracks adding <code class="language-plaintext highlighter-rouge">_rev</code> checks for that.</li>
  <li>Text only. Binary attachments aren’t exposed.</li>
  <li>You’re giving an agent write access to your second brain. Keep backups, set <code class="language-plaintext highlighter-rouge">MCP_AUTH_TOKEN</code>, use tool approval deliberately, and reach for <code class="language-plaintext highlighter-rouge">READ_ONLY</code> when you don’t need writes.</li>
</ul>

<p><strong>One blunt warning before you point this at a vault you care about.</strong> Most of the heavy lifting here is LiveSync’s, and LiveSync can go sideways, especially once E2E encryption is in the mix. A mismatched passphrase or obfuscation setting can fail to sync or mangle notes without a single error message. On top of that, an agent with write access can delete or overwrite the wrong thing in one bad call. So: back up your vault before you connect any of this, keep backing it up, test against a throwaway vault first, and run <code class="language-plaintext highlighter-rouge">READ_ONLY</code> whenever you only need reads. This is MIT software provided as-is, with no warranty. I take no responsibility for lost or corrupted notes. Your vault, your risk.</p>

<h2 id="closing-thought">Closing thought</h2>

<p>The MCP server is the small part. The real shift is in how we use a second brain at all. It used to be a place you filed things by hand and came back to read. Now we think out loud with an AI, and the worthwhile parts should just settle into the vault on their own. The strange thing is how little had to be built for that. The notes were already in an open database. The agents already spoke a protocol for tools. Nobody had wired the two together.</p>

<p>I connected them because I wanted to drop an idea into a note from a bus and have Claude file it properly. It’s a small project, but it turns out I wasn’t the only one who wanted their notes within reach of an AI, and the handful of people using it have already made it better than I would have alone.</p>

<hr />

<h3 id="links">Links</h3>

<ul>
  <li>Obsidian Sync MCP (source): <a href="https://github.com/es617/obsidian-sync-mcp">GitHub</a></li>
  <li>Self-hosted LiveSync: <a href="https://github.com/vrtmrz/obsidian-livesync">GitHub</a></li>
  <li>Model Context Protocol: <a href="https://modelcontextprotocol.io">modelcontextprotocol.io</a></li>
</ul>]]></content><author><name>Enrico Santagati</name></author><category term="mcp" /><category term="obsidian" /><category term="agents" /><category term="couchdb" /><category term="livesync" /><category term="second-brain" /><category term="self-hosted" /><category term="tooling" /><summary type="html"><![CDATA[My notes were on every device I own, but Claude couldn't reach them while I was on the go. So I built an MCP server to fix that.]]></summary></entry><entry><title type="html">Training Apple’s On-Device LLM: LoRA, QLoRA, and What Actually Worked</title><link href="https://es617.dev/2026/04/19/training-apple-on-device-llm.html" rel="alternate" type="text/html" title="Training Apple’s On-Device LLM: LoRA, QLoRA, and What Actually Worked" /><published>2026-04-19T00:00:00+00:00</published><updated>2026-04-19T00:00:00+00:00</updated><id>https://es617.dev/2026/04/19/training-apple-on-device-llm</id><content type="html" xml:base="https://es617.dev/2026/04/19/training-apple-on-device-llm.html"><![CDATA[<hr />

<p>In the <a href="/2026/04/08/apple-on-device-llm-shell.html">previous article</a>, I benchmarked Apple’s on-device 3B model for shell command generation and got it to ~80% accuracy using retrieval (dynamic few-shot examples from a 21k-entry bank). That was the ceiling I could reach without touching the model’s weights, or growing the bank size.</p>

<p>Apple’s FoundationModels framework also supports custom adapters. You can train LoRA weights, export them as <code class="language-plaintext highlighter-rouge">.fmadapter</code> files, and load them at inference time. The model stays frozen; you’re adding a small set of correction matrices that steer its outputs. This is the next logical step — not because I plan to ship adapters (distributing ~160MB adapter files for a lightweight CLI isn’t practical), but to understand the training experience: what does Apple’s toolkit look like, what does it take to get training running on accessible hardware, and do the resulting adapters actually work?</p>

<p><img src="/assets/images/posts/training-apple-on-device-llm/hero.png" alt="Training Apple's on-device LLM" class="align-center" /></p>

<p>The short version: the toolkit assumes a beefy GPU, but with some work I got training running on a free Colab T4 and eventually on a Mac. The adapters work — and the training method and platform don’t matter much. Along the way I found a caching bug in Apple’s inference service that silently consumed 269GB of disk space.</p>

<blockquote>
  <p><strong>Disclaimer (April 2026):</strong> There is a known bug where loading adapters from a command-line tool leaks ~160MB per invocation to a SIP-protected cache with no cleanup. Apple has confirmed this is specific to CLI tools — app bundles are not affected. I detail the bug <a href="#the-bug-invisible-disk-consumption">below</a>. The shipped version of hunch does not use adapters, so this doesn’t affect normal usage.</p>
</blockquote>

<hr />

<h2 id="a-quick-primer-on-lora">A quick primer on LoRA</h2>

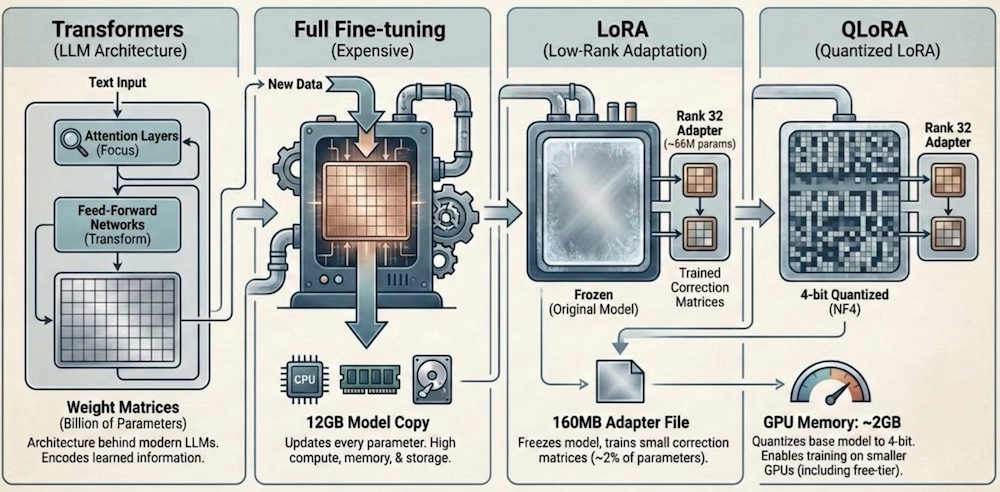
<p>If you’re not familiar with how adapter training works, here’s the short version.</p>

<p><img src="/assets/images/posts/training-apple-on-device-llm/primer.png" alt="LoRA and QLoRA primer" class="align-center" /></p>

<p><strong>Transformers</strong> are the architecture behind modern LLMs. They process text through layers of attention (deciding which parts of the input to focus on) and feed-forward networks (transforming representations). Each layer has large weight matrices, millions of parameters that encode what the model has learned.</p>

<p><strong>Fine-tuning</strong> means updating those weights on new data so the model learns new behavior. Full fine-tuning updates every parameter, which for a 3B model means moving ~12GB of weights through the optimizer. It’s expensive in compute, memory, and storage.</p>

<p><strong>LoRA</strong> (Low-Rank Adaptation) is the shortcut. Instead of updating the full weight matrices, you freeze the original model and attach small “correction” matrices to specific layers. If a weight matrix is 2048×2048 (~4M parameters), LoRA decomposes the update into two small matrices: 2048×32 and 32×2048 (~131K parameters). The rank (32 in this case) controls how much capacity the adapter has. You train only these small matrices. Across all 56 transformer layers in Apple’s 3B model, that works out to ~66M trainable parameters, about 2% of the full model. The result is a ~160MB adapter file instead of a 12GB model copy.</p>

<p><strong>QLoRA</strong> goes one step further. It quantizes the frozen base model to 4-bit precision (NF4 format), compressing it from ~12GB to ~2GB in GPU memory. The LoRA matrices themselves stay in higher precision for training stability. The practical effect: you can train on GPUs with much less memory, including free-tier ones.</p>

<hr />

<h2 id="apples-toolkit-and-the-hardware-wall">Apple’s toolkit and the hardware wall</h2>

<p>Apple ships an Adapter Training Toolkit, a Python package (~12GB including base model weights) that handles data loading, LoRA configuration, training loops, and export to the <code class="language-plaintext highlighter-rouge">.fmadapter</code> format. The official requirements are “Mac with Apple silicon and at least 32GB memory, or Linux GPU machines.”</p>

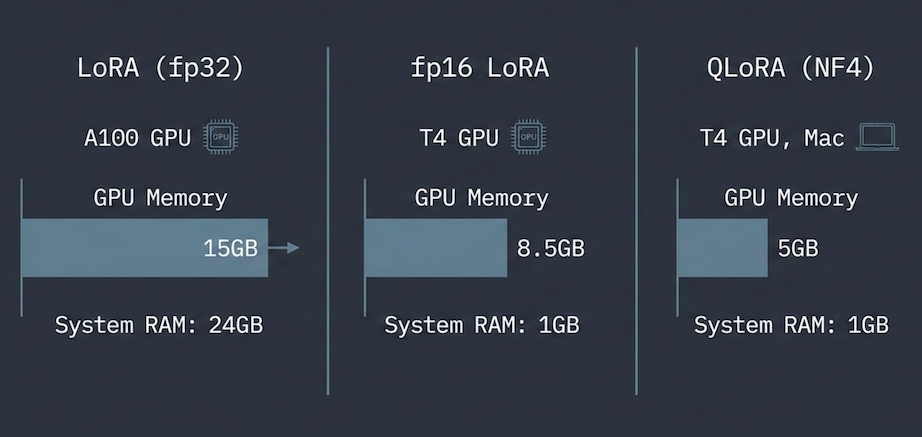
<p>In practice, the memory requirements are steep. The base model is 12GB in fp32. The toolkit loads it without memory mapping, so during loading the checkpoint and the model parameters both live in system RAM — ~24GB peak. The GPU side needs ~15GB for the training loop. But the system RAM spike is the real bottleneck: a Colab T4 has 16GB VRAM but only 12GB system RAM, so training OOMs before it even reaches the GPU. I used an A100 (80GB system RAM) where this isn’t an issue. A 32GB Mac might technically fit, but it’s tight. My 24GB MacBook Air M4 OOM’d immediately.</p>

<p>The memory breakdown is straightforward once you look at the loading pipeline, and each bottleneck has a fix. Getting it to run on a free Colab T4 and eventually on a Mac took three iterations.</p>

<p><img src="/assets/images/posts/training-apple-on-device-llm/progression.png" alt="Training infrastructure progression" class="align-center" /></p>

<hr />

<h2 id="getting-training-onto-a-free-t4">Getting training onto a free T4</h2>

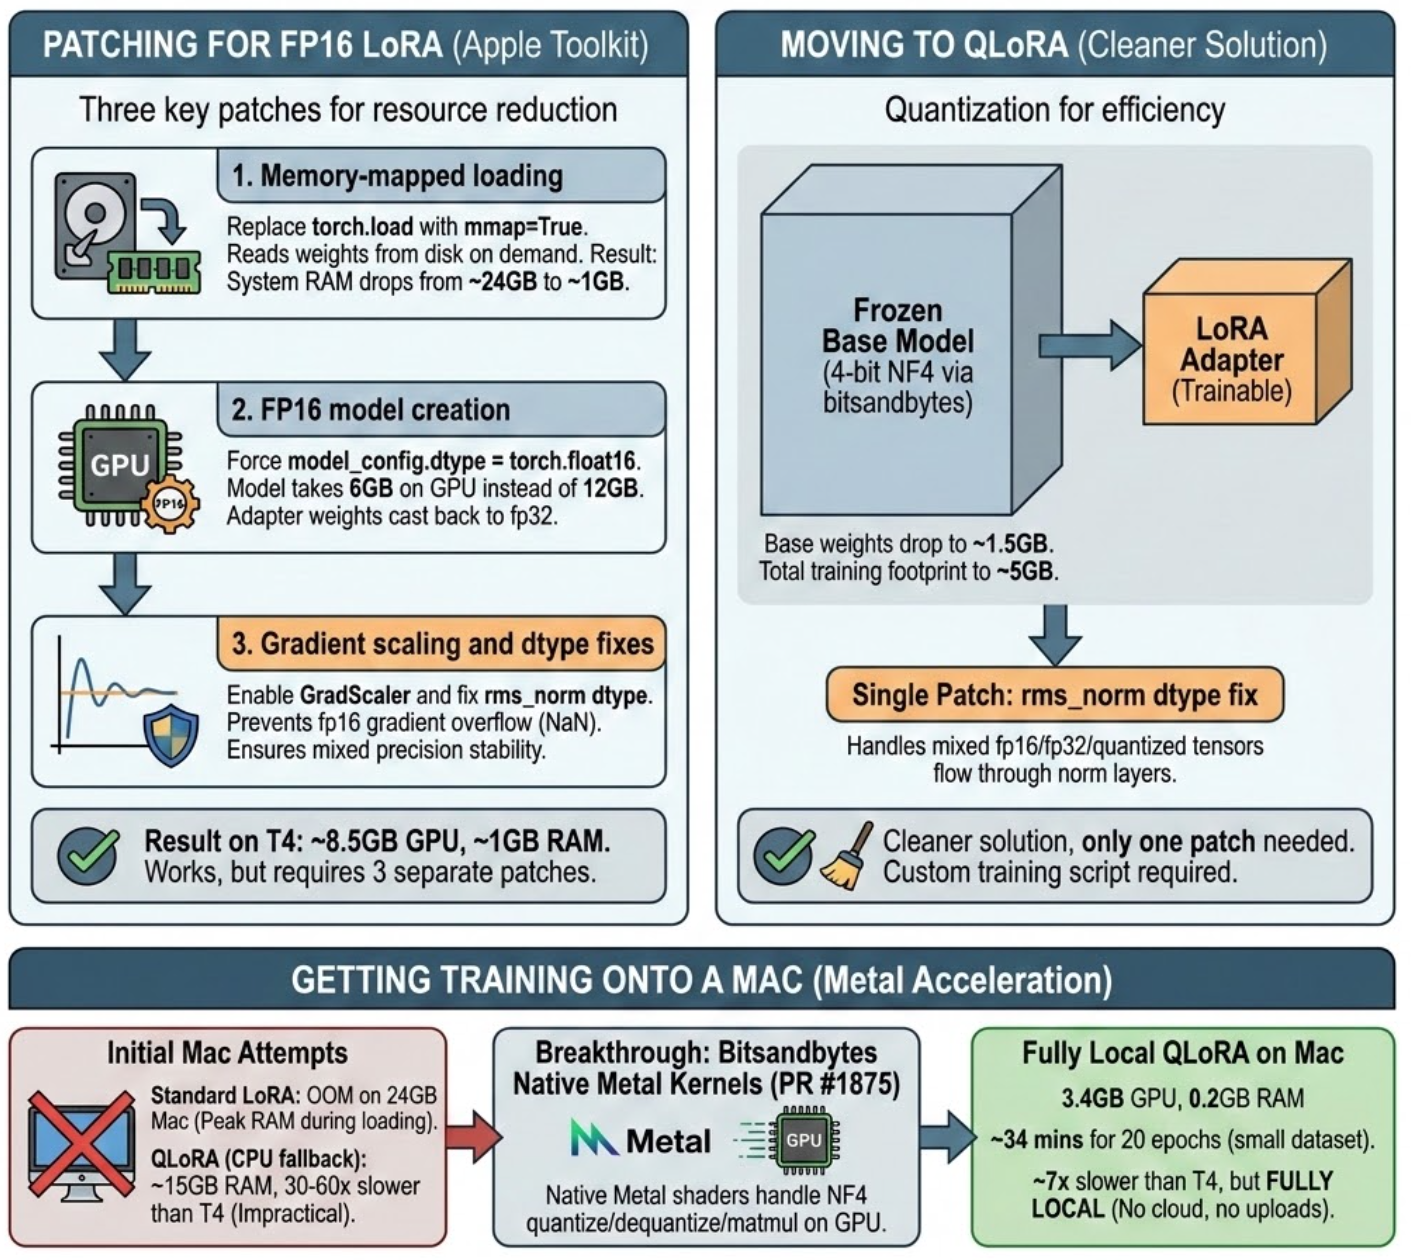
<p>A Colab T4 has 16GB VRAM and only 12GB system RAM. The ~15GB training footprint barely fits on the 16GB GPU, but the ~24GB loading spike doesn’t fit in system RAM — training OOMs before it starts. My first attempt was patching Apple’s pipeline directly. Three changes:</p>

<ol>
  <li><strong>Memory-mapped loading.</strong> Replace <code class="language-plaintext highlighter-rouge">torch.load</code> with <code class="language-plaintext highlighter-rouge">mmap=True</code> to read weights from disk on demand instead of materializing 12GB in RAM. System RAM drops from ~24GB to ~6GB.</li>
  <li><strong>fp16 model creation.</strong> Force <code class="language-plaintext highlighter-rouge">model_config.dtype = torch.float16</code> so the model takes 6GB on GPU instead of 12GB, with adapter weights cast back to fp32 for gradient scaling.</li>
  <li><strong>Gradient scaling and dtype fixes.</strong> Apple’s training script only enables <code class="language-plaintext highlighter-rouge">GradScaler</code> for a precision mode that isn’t exposed as a CLI option. Without it, fp16 gradients overflow to NaN. A separate fix in <code class="language-plaintext highlighter-rouge">rms_norm</code> casts weight tensors to match input dtype in mixed precision.</li>
</ol>

<p>With all three patches, fp16 LoRA trains on a T4: ~8.5GB GPU, ~6GB RAM. It works, but it’s three patches to Apple’s code and still uses over half the T4’s memory.</p>

<p>QLoRA is cleaner. It quantizes the frozen base model’s Linear layers to 4-bit NF4 via <code class="language-plaintext highlighter-rouge">bitsandbytes</code>, dropping the base model to ~2GB and total training footprint to ~5GB. The <code class="language-plaintext highlighter-rouge">rms_norm</code> dtype patch is still needed (mixed fp16/fp32/quantized tensors flow through norm layers), but only one patch instead of three. I wrote a custom training script around it since the toolkit doesn’t support quantized training natively.</p>

<table>
  <thead>
    <tr>
      <th> </th>
      <th>LoRA (fp32)</th>
      <th>fp16 LoRA</th>
      <th>QLoRA (NF4)</th>
    </tr>
  </thead>
  <tbody>
    <tr>
      <td><strong>Training footprint on GPU</strong></td>
      <td>~15GB</td>
      <td>~8.5GB</td>
      <td>~5GB</td>
    </tr>
    <tr>
      <td><strong>System RAM peak</strong></td>
      <td>~24GB</td>
      <td>~6GB</td>
      <td>~6GB</td>
    </tr>
    <tr>
      <td><strong>Toolkit</strong></td>
      <td>Apple’s, unmodified</td>
      <td>Apple’s, 3 patches</td>
      <td>Custom script (1 shared patch)</td>
    </tr>
    <tr>
      <td><strong>Cost</strong></td>
      <td>Colab Pro</td>
      <td>Free</td>
      <td>Free</td>
    </tr>
  </tbody>
</table>

<hr />

<h2 id="getting-training-onto-a-mac">Getting training onto a Mac</h2>

<p>Standard LoRA OOM’d on my 24GB Mac — the ~24GB RAM peak during model loading leaves nothing for training. QLoRA with mmap loading fits comfortably at ~5GB GPU, but trains ~9x slower than a free Colab T4. The bottleneck: bitsandbytes has no native MPS kernels in its current release (0.49.2), so NF4 dequantization falls back to CPU.</p>

<p>bitsandbytes recently merged <a href="https://github.com/bitsandbytes-foundation/bitsandbytes/pull/1875">native Metal kernel support</a> into main, expected in v0.50.0. Installing from git (<code class="language-plaintext highlighter-rouge">pip install git+https://github.com/bitsandbytes-foundation/bitsandbytes.git</code>) brings lower GPU memory usage and ~2x faster training on the short override dataset that produces the best adapters, cutting the T4 gap from ~9x to ~4x. Slower, but fully local — no cloud, no uploads, no Colab session management. And the adapter quality is identical.</p>

<hr />

<h2 id="do-the-adapters-actually-work">Do the adapters actually work?</h2>

<p>With the training infrastructure in place, I needed to verify the adapters actually improve the model. I trained on two datasets: the full 21k tldr bank, and a small set of curated overrides (~96 total, reduced to ~57 after excluding benchmark prompts to avoid data leakage) I’d hand-written to fill gaps in the model’s knowledge (macOS-specific commands, flag corrections, common mistakes).</p>

<p>The full bank made things worse: the adapter learned noise from 4,500 different commands and interfered with retrieval. The overrides worked. Not a surprising result (targeted data beats noisy data), but it confirmed the pipeline produces usable adapters.</p>

<table>
  <thead>
    <tr>
      <th>Approach</th>
      <th>Trained on</th>
      <th>Exact Match</th>
      <th>vs Retrieval Baseline</th>
    </tr>
  </thead>
  <tbody>
    <tr>
      <td><strong>QLoRA override + retrieval</strong></td>
      <td>Mac</td>
      <td><strong>~86%</strong></td>
      <td><strong>+6pp</strong></td>
    </tr>
    <tr>
      <td>LoRA override + retrieval</td>
      <td>A100</td>
      <td>~85%</td>
      <td>+5pp</td>
    </tr>
    <tr>
      <td>QLoRA override + retrieval</td>
      <td>T4</td>
      <td>~85%</td>
      <td>+5pp</td>
    </tr>
    <tr>
      <td>Retrieval only (shipped)</td>
      <td>—</td>
      <td>~80%</td>
      <td>reference</td>
    </tr>
    <tr>
      <td>QLoRA override only</td>
      <td>Mac</td>
      <td>~76%</td>
      <td>-4pp</td>
    </tr>
    <tr>
      <td>QLoRA override only</td>
      <td>T4</td>
      <td>~74%</td>
      <td>-6pp</td>
    </tr>
    <tr>
      <td>Bare model</td>
      <td>—</td>
      <td>~41%</td>
      <td>—</td>
    </tr>
  </tbody>
</table>

<p>The important comparisons for validating the training pipeline:</p>

<p><strong>Adapters work.</strong> Standalone, they lift the bare model from ~41% to ~74-76%. Combined with retrieval, accuracy pushes into the ~85-86% range. Retrieval alone averages ~80% (with variance up to ~83% across runs), so the gain is modest but consistent across all training methods and platforms.</p>

<p><strong>LoRA ≈ QLoRA ≈ Mac.</strong> All three paths land in the same range: ~85-86% with retrieval, ~74-76% standalone. QLoRA on a free T4 produces the same quality adapter as full LoRA on a paid A100, and Mac-trained adapters match both.</p>

<p>Pushing accuracy higher wasn’t the goal here. The point was to verify that adapters trained across different methods (LoRA, QLoRA) and platforms (A100, T4, Mac) all produce equivalent results, and that the cheaper paths don’t sacrifice quality.</p>

<hr />

<h2 id="the-bug-invisible-disk-consumption">The bug: invisible disk consumption</h2>

<p>While running adapter benchmarks, my 500GB SSD dropped to 10GB free, but <code class="language-plaintext highlighter-rouge">du</code> showed only ~230GB used. The missing space was invisible to every standard macOS tool, even <code class="language-plaintext highlighter-rouge">sudo</code>.</p>

<p>The cause: each call to <code class="language-plaintext highlighter-rouge">SystemLanguageModel.Adapter(fileURL:)</code> triggers Apple’s inference service to write a full ~160MB copy of the adapter to a SIP-protected cache directory (<code class="language-plaintext highlighter-rouge">/private/var/db/AppleIntelligencePlatform/AppModelAssets/</code>). Each copy gets a unique hash and there’s no cleanup. Over ~300 benchmark runs: <strong>1,684 cached copies, ~269GB</strong>. Only visible from Recovery Mode (which bypasses SIP).</p>

<p>Apple has confirmed the bug is specific to command-line tools — app bundles are not affected. To reclaim space, boot Recovery Mode and delete the cache directory contents.</p>

<hr />

<h2 id="where-this-leaves-us">Where this leaves us</h2>

<p>The toolkit works. You can go from dataset to working on-device adapter in an afternoon. But the experience is firmly an ML engineer’s workflow: Python scripts, PyTorch, bring-your-own-GPU, debug your own dtype mismatches. If you’ve fine-tuned models before, you’ll feel at home. If you’re an iOS developer who’s never touched a training loop, there’s a steep ramp.</p>

<p>Apple has a track record of eventually abstracting these workflows. Create ML turned image classification and object detection training into a drag-and-drop Xcode experience. It’s easy to imagine a similar path here — a “Create LLM” that wraps the toolkit into something Xcode-native, with managed training on Apple silicon and one-click export to <code class="language-plaintext highlighter-rouge">.fmadapter</code>. The pieces are all there; the developer experience just hasn’t caught up yet.</p>

<p>I’m not shipping adapters with hunch; ~160MB per adapter doesn’t fit a lightweight CLI, independently from the bug. But the training pipeline, patches, and notebooks are in the <a href="https://github.com/es617/hunch">hunch repo</a> with a <a href="https://github.com/es617/hunch/blob/main/training/TRAINING.md">training guide</a> if you want to try it yourself:</p>

<ul>
  <li><strong>LoRA notebook</strong> — end-to-end pipeline around Apple’s toolkit (needs a 24GB+ GPU)</li>
  <li><strong>fp16 LoRA notebook</strong> — same pipeline with three patches to run on a free Colab T4</li>
  <li><strong>QLoRA notebook + training script</strong> — 4-bit quantized training via <code class="language-plaintext highlighter-rouge">bitsandbytes</code>, runs on a free T4 or locally on Mac</li>
  <li><strong>MPS setup instructions</strong> — installing bitsandbytes from main with native Metal kernels</li>
  <li><strong>Bug workaround</strong> — batch mode for the adapter caching leak, and Recovery Mode cleanup</li>
</ul>]]></content><author><name>Enrico Santagati</name></author><category term="llm" /><category term="on-device" /><category term="apple" /><category term="macos" /><category term="lora" /><category term="qlora" /><category term="training" /><category term="adapter" /><category term="hunch" /><category term="edge-ai" /><summary type="html"><![CDATA[Apple's adapter toolkit assumes a beefy GPU. I got it running on a free Colab T4 and a 24GB Mac, and found a caching bug that ate 269GB along the way.]]></summary></entry><entry><title type="html">When Your AI Tools Can’t Talk to Each Other</title><link href="https://es617.dev/2026/04/15/cc-tap.html" rel="alternate" type="text/html" title="When Your AI Tools Can’t Talk to Each Other" /><published>2026-04-15T00:00:00+00:00</published><updated>2026-04-15T00:00:00+00:00</updated><id>https://es617.dev/2026/04/15/cc-tap</id><content type="html" xml:base="https://es617.dev/2026/04/15/cc-tap.html"><![CDATA[<hr />

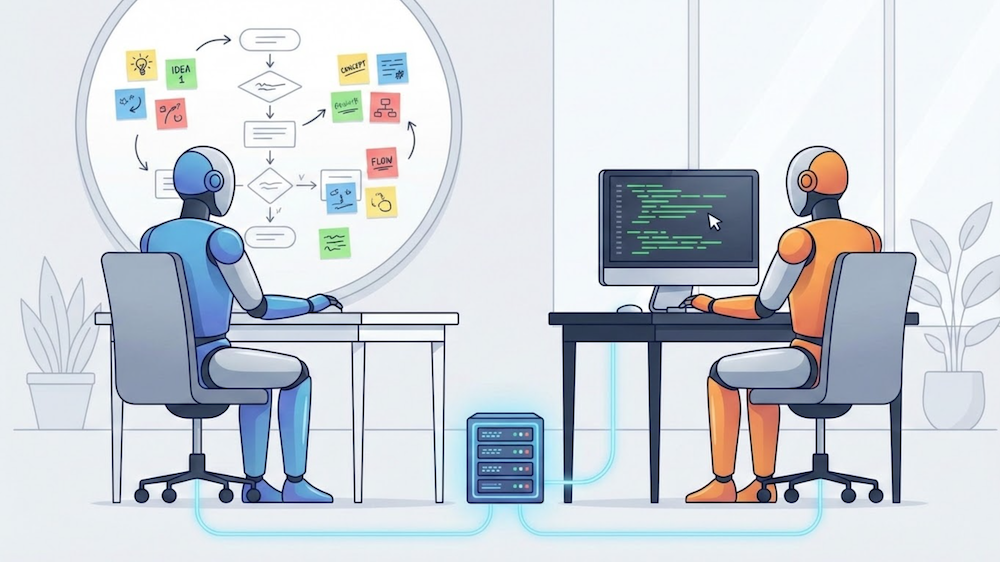
<p>I use Claude Desktop for brainstorming: exploring ideas, thinking through architecture, working out strategy. I use Claude Code for implementation: planning in the codebase, writing and testing code, running builds. Different modes of thinking, different tools. Like wanting a whiteboard for one task and a terminal for another.</p>

<p>The problem is they can’t see each other.</p>

<p>A brainstorming session on Desktop might surface a design idea that I want the Code session to act on. Or a design question on Desktop needs to know how something was actually implemented but the answer lives in the Code session’s context. The information flows both ways: Desktop pushes ideas down, and needs to pull implementation details up.</p>

<p>But there’s no way to do either. I copy-paste fragments, re-explain things, re-establish context that already exists in another window. Two AI agents, both with deep context on my project, completely unaware of each other.</p>

<p>Anthropic recently introduced <a href="https://code.claude.com/docs/en/remote-control">Remote Control</a>, a way to access your local CC session from the web or mobile. It solves a real problem: your laptop’s session, reachable from your phone. But it’s the same you, driving the same session, from a different screen. One agent, two windows.</p>

<p>What I want is different. I want the Desktop conversation (a separate agent, with its own context) to reach into a running Code session, see what’s there, and send it a message. Not multi-device single-user. Multi-agent. That axis isn’t covered.</p>

<p><img src="/assets/images/posts/cc-tap/cc-tap-hero.png" alt="cc-tap hero" class="align-center" /></p>

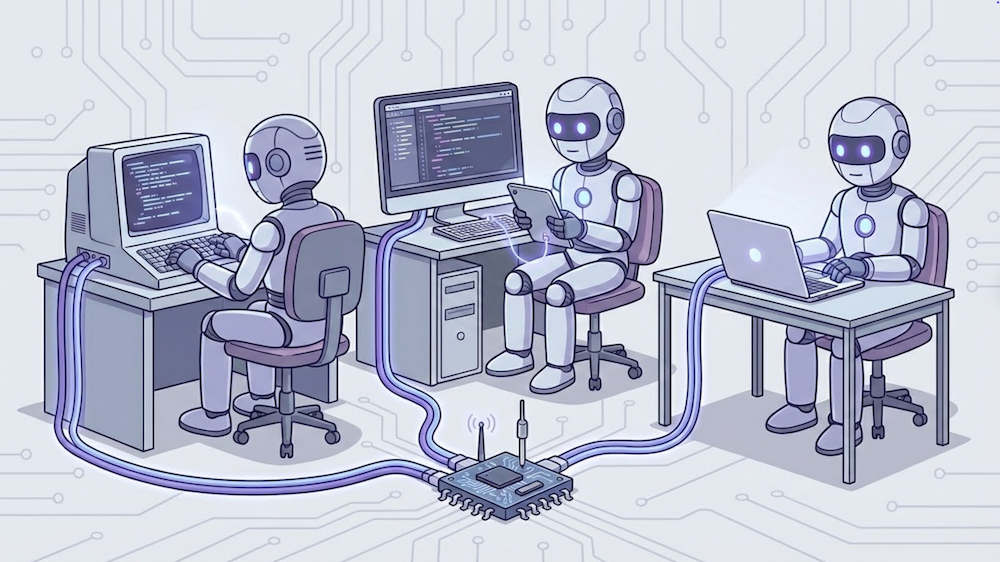
<p>So I mapped the session protocol that Claude Code’s web UI uses, and built an <a href="https://github.com/es617/cc-tap">experimental MCP server</a> that lets Claude Desktop read and interact with running Code sessions. It uses undocumented APIs that could change at any time, but it works today and the protocol itself is the interesting part.</p>

<h2 id="the-api-is-already-there">The API is already there</h2>

<p>Both Remote Control and <a href="https://code.claude.com/docs/en/claude-code-on-the-web">Claude Code on the web</a> use the same session protocol under the hood. I captured the browser traffic with HAR exports and mapped the endpoints. The protocol has three layers:</p>

<p><strong>HTTP REST</strong> for session management. List sessions, read event history, send messages. Uses your existing OAuth token against <code class="language-plaintext highlighter-rouge">api.anthropic.com</code>. This is the workhorse: straightforward REST, well-structured responses, and it works from any HTTP client.</p>

<p><strong>WebSocket</strong> for real-time streaming and tool approval. The web UI at claude.ai/code uses a WebSocket to receive events as they happen and to relay tool approvals back to the session. This is behind Cloudflare’s bot protection: TLS fingerprinting, JS challenges, browser verification. A non-browser client gets a 403.</p>

<p><strong>Polling</strong> as a fallback. Without WebSocket access, an external client can poll the event history endpoint every 1-2 seconds. You get ~1.5s latency instead of real-time, but it works with just an OAuth token.</p>

<p>The session model already supports multiple clients connecting to the same session. That’s not an accident. It’s how the web UI works.</p>

<div class="mermaid">
%%{init: {'theme': 'dark', 'themeVariables': {'edgeLabelBackground': 'transparent'}}}%%
graph LR
    CD["🖥️ Claude<br />Desktop"] --- TAP["⚙️ cc-tap<br />MCP Server"]
    CC2["🖥️ Claude<br />Code B"] --- TAP
    TAP --&gt;|"HTTP REST<br />OAuth"| API["☁️ api.anthropic.com"]
    TAP -.-x|"WebSocket<br />🚫 Cloudflare"| WS["☁️ claude.ai"]
    API --&gt;|"events/messages"| CC1["🖥️ Claude<br />Code A"]
    WS --&gt;|"streaming +<br />tool approval"| CC1
    style CD fill:#2d1b69,stroke:#b794f4,stroke-width:2px,color:#fff
    style CC2 fill:#2d1b69,stroke:#b794f4,stroke-width:2px,color:#fff
    style TAP fill:#4a1942,stroke:#f687b3,stroke-width:2px,color:#fff
    style API fill:#1a365d,stroke:#63b3ed,stroke-width:2px,color:#fff
    style WS fill:#1a365d,stroke:#63b3ed,stroke-width:2px,color:#fff
    style CC1 fill:#2d1b69,stroke:#b794f4,stroke-width:2px,color:#fff
</div>

<p>The full protocol is documented in <a href="https://github.com/es617/cc-tap/blob/main/PROTOCOL.md">PROTOCOL.md</a> in the repo.</p>

<h2 id="the-build">The build</h2>

<p><a href="https://github.com/es617/cc-tap">cc-tap</a> is an MCP server that exposes Claude Code sessions as tools. Install it in Claude Desktop or another Claude Code session, and you can see into and interact with running CC sessions.</p>

<div class="language-bash highlighter-rouge"><div class="highlight"><pre class="highlight"><code>pip <span class="nb">install </span>cc-tap
claude mcp add cc-tap <span class="nt">--</span> cc_tap
</code></pre></div></div>

<p>Requires <code class="language-plaintext highlighter-rouge">claude /login</code> and <a href="https://code.claude.com/docs/en/remote-control">Remote Control</a> enabled.</p>

<p>Six tools:</p>

<table>
  <thead>
    <tr>
      <th>Tool</th>
      <th>What it does</th>
    </tr>
  </thead>
  <tbody>
    <tr>
      <td><code class="language-plaintext highlighter-rouge">list_sessions</code></td>
      <td>List CC sessions, filter by status</td>
    </tr>
    <tr>
      <td><code class="language-plaintext highlighter-rouge">get_session_info</code></td>
      <td>Session details: title, status, working directory</td>
    </tr>
    <tr>
      <td><code class="language-plaintext highlighter-rouge">read_session</code></td>
      <td>Read recent conversation from a session</td>
    </tr>
    <tr>
      <td><code class="language-plaintext highlighter-rouge">get_session_events</code></td>
      <td>Raw event stream, filterable by type</td>
    </tr>
    <tr>
      <td><code class="language-plaintext highlighter-rouge">send_message</code></td>
      <td>Send a message to a CC session (fire and forget)</td>
    </tr>
    <tr>
      <td><code class="language-plaintext highlighter-rouge">send_and_wait</code></td>
      <td>Send a message and wait for the full response</td>
    </tr>
  </tbody>
</table>

<p>With this, a Claude Desktop session can ask “what are my running Code sessions?” and get a list. It can read what a Code session has been working on. It can send a message to a Code session (“run the test suite,” “what’s the status of the refactor?”) and get back the response. A second Code session can coordinate with a first one.</p>

<p>It uses the same OAuth credentials you already have from <code class="language-plaintext highlighter-rouge">claude /login</code>. No additional auth, no API keys. cc-tap reads them from your macOS Keychain (or <code class="language-plaintext highlighter-rouge">~/.claude/.credentials.json</code> on Linux) and talks to the same API the web UI does.</p>

<h2 id="where-it-stops-working">Where it stops working</h2>

<p>It mostly works. But there’s one place where it doesn’t, and that’s the most interesting part.</p>

<p>When a Claude Code session needs to run a tool (read a file, execute a command, make an edit) it asks for permission. In the terminal, you approve it by pressing Enter. In the web UI, you click a button. That approval travels to the session runtime via WebSocket.</p>

<p>cc-tap can see these pending tool requests through polling. But it can’t approve them.</p>

<p>The reason isn’t just that the WebSocket at <code class="language-plaintext highlighter-rouge">claude.ai</code> is behind Cloudflare’s bot protection (though it is — a non-browser client gets a 403). The deeper issue is architectural: control responses sent via HTTP POST are stored in event history but never relayed to the session worker. The worker only picks them up from an active WebSocket connection. So even if you got past Cloudflare, the HTTP path wouldn’t work for approvals. The control channel is WebSocket-shaped by design.</p>

<p>There are WebSocket endpoints on <code class="language-plaintext highlighter-rouge">api.anthropic.com</code> too, but they appear to require a session-scoped ingress token issued through a worker registration flow. I tested three different endpoint/auth combinations, all returned 403. The details are in the <a href="https://github.com/es617/cc-tap/blob/main/PROTOCOL.md#open-questions">Open Questions</a> section of the protocol doc.</p>

<p>The practical effect: the read path (listing sessions, reading events, sending messages) works over plain HTTP with OAuth. The control path (approving tool use) is WebSocket-only, and those endpoints aren’t reachable from external clients.</p>

<h2 id="what-this-is--and-isnt">What this is — and isn’t</h2>

<p>This is an exploration, not a production tool. The API is undocumented and could change tomorrow. Polling adds ~1.5 seconds of latency. Tool approval requires the CC terminal or the web UI. The protocol documentation is reverse-engineered from one person’s traffic captures — there’s almost certainly more surface area I haven’t found.</p>

<p>Things worth exploring further:</p>

<ul>
  <li><strong>Real-time streaming.</strong> The WebSocket endpoints exist for real-time event delivery. Getting access from a non-browser client would eliminate the polling latency.</li>
  <li><strong>Structured coordination patterns.</strong> Right now cc-tap is a bridge: read and write. But the primitives are there for higher-level patterns: one session delegating subtasks to another, a Desktop session acting as a supervisor for multiple Code sessions, or an orchestrator that routes work based on session state.</li>
  <li><strong>Tool approval relay.</strong> The biggest limitation. If the WebSocket becomes accessible, or if Anthropic exposes a REST endpoint for control responses, cc-tap could go from observer to full participant.</li>
</ul>

<p>The value right now is the proof that it works and the protocol documentation. Both show that multi-client session access isn’t hypothetical. It’s implemented, just not exposed as a platform primitive.</p>

<h2 id="closing-thought">Closing thought</h2>

<p>Anthropic built MCP, an open protocol so that any agent can talk to any tool. They also built multi-client session infrastructure so that their web UI, mobile app, and CLI can all attach to the same running session.</p>

<p>What they haven’t done is connect these two things. There’s no MCP surface for session-level operations. No way for one Claude instance to discover or interact with another through the protocol Anthropic designed for exactly that kind of interoperability.</p>

<p>cc-tap bridges the gap from the outside, using the same session API the web UI uses, exposed as MCP tools. It works because the pieces are already there. The session model supports multiple clients. The event stream is readable over HTTP. Messages can be injected by any authenticated client. The architecture is ready. It just hasn’t been unbundled.</p>

<p>If anyone at Anthropic is thinking about exposing CC sessions through MCP, the tool list in <a href="https://github.com/es617/cc-tap">cc-tap</a> is one shape that surface could take.</p>

<hr />

<h3 id="links">Links</h3>

<ul>
  <li>cc-tap (source): <a href="https://github.com/es617/cc-tap">GitHub</a></li>
  <li>cc-tap (package): <a href="https://pypi.org/project/cc-tap/">PyPI</a></li>
  <li>Protocol documentation: <a href="https://github.com/es617/cc-tap/blob/main/PROTOCOL.md">PROTOCOL.md</a></li>
</ul>]]></content><author><name>Enrico Santagati</name></author><category term="claude-code" /><category term="claude-desktop" /><category term="mcp" /><category term="agents" /><category term="remote-control" /><category term="tooling" /><summary type="html"><![CDATA[Claude Desktop and Claude Code are separate worlds. Here's an MCP server that bridges them.]]></summary></entry><entry><title type="html">The 3B Wall: What Apple’s On-Device LLM Can and Can’t Do in Your Shell</title><link href="https://es617.dev/2026/04/08/apple-on-device-llm-shell.html" rel="alternate" type="text/html" title="The 3B Wall: What Apple’s On-Device LLM Can and Can’t Do in Your Shell" /><published>2026-04-08T00:00:00+00:00</published><updated>2026-04-08T00:00:00+00:00</updated><id>https://es617.dev/2026/04/08/apple-on-device-llm-shell</id><content type="html" xml:base="https://es617.dev/2026/04/08/apple-on-device-llm-shell.html"><![CDATA[<hr />

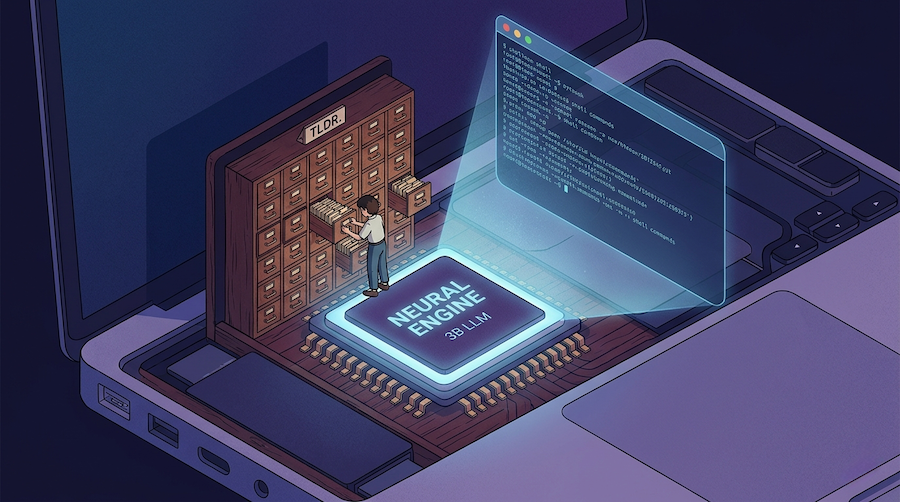
<p>Apple quietly shipped a 3B-parameter LLM on every Mac running macOS Tahoe. It sits on the Neural Engine, powers Siri and Writing Tools, and is accessible through the FoundationModels Swift framework, but there’s no direct way to use it outside of building a custom app.</p>

<p><a href="https://github.com/Arthur-Ficial/apfel">apfel</a> changed that. A Swift CLI that wraps FoundationModels and gives the on-device model a command-line interface. It hit the front page of Hacker News and proved the model was usable from the terminal. That got me thinking: what if I built something more specialized?</p>

<p>macOS’s default shell, zsh, has hooks that fire before you run a command, when a command isn’t found, and after a command fails. They’ve always been there, but the options were either deterministic (Levenshtein-based “did you mean”), or an LLM that’s either too slow locally or requires a cloud roundtrip. A 3B model on the Neural Engine responding in under a second changes the tradeoff.</p>

<p><img src="/assets/images/posts/apple-on-device-llm-shell/hunch-hero.png" alt="hunch — on-device LLM shell commands" class="align-center" /></p>

<p>I wired all three hooks to the on-device model. It worked for simple things, then started hallucinating flags. So I benchmarked multiple approaches across 100 prompts to find out what actually helps, built the winning approach into a CLI called <a href="https://github.com/es617/hunch">hunch</a>, and learned something about where the 3B wall actually is.</p>

<hr />

<h2 id="the-three-hooks">The three hooks</h2>

<p>zsh has three built-in extension points that fire at specific moments in the command lifecycle. Each one is a natural place to put an LLM call:</p>

<table>
  <thead>
    <tr>
      <th>Hook</th>
      <th>When it fires</th>
      <th>What I wired it to</th>
    </tr>
  </thead>
  <tbody>
    <tr>
      <td><strong><code class="language-plaintext highlighter-rouge">zle</code> widget (Ctrl+G)</strong></td>
      <td>Before you run a command</td>
      <td>Natural language → shell command. Replaces the buffer, you inspect before hitting Enter. <strong>Never executes anything.</strong></td>
    </tr>
    <tr>
      <td><strong><code class="language-plaintext highlighter-rouge">command_not_found_handler</code></strong></td>
      <td>Command isn’t in <code class="language-plaintext highlighter-rouge">$PATH</code></td>
      <td><code class="language-plaintext highlighter-rouge">gti push</code> → <code class="language-plaintext highlighter-rouge">did you mean: git push</code>. <code class="language-plaintext highlighter-rouge">ip a</code> → <code class="language-plaintext highlighter-rouge">did you mean: ifconfig</code>.</td>
    </tr>
    <tr>
      <td><strong><code class="language-plaintext highlighter-rouge">TRAPZERR</code></strong></td>
      <td>Non-zero exit code</td>
      <td>One-line explanation of what went wrong, in dim grey. Skips signals, benign exits (<code class="language-plaintext highlighter-rouge">grep</code> no-match, <code class="language-plaintext highlighter-rouge">diff</code>), and commands containing tokens or passwords.</td>
    </tr>
  </tbody>
</table>

<p>The Ctrl+G hook is the main one. Type a description, hit Ctrl+G, the buffer gets replaced:</p>

<p><img src="/assets/images/posts/apple-on-device-llm-shell/demo.gif" alt="Ctrl+G demo — type a description, hit Ctrl+G, get the command" class="align-center" /></p>

<p>The key safety property: <strong>Ctrl+G never runs anything</strong>. It fills the buffer. You always read before you execute.</p>

<hr />

<h2 id="the-40-baseline">The 40% baseline</h2>

<p>Simple commands work. Typo correction is reliable. But the moment you ask for anything with specific flags, the model hallucinates.</p>

<blockquote>
  <p>find files changed in the last hour → <code class="language-plaintext highlighter-rouge">find . -mtime +1h</code></p>
</blockquote>

<p>This is wrong in three ways (<code class="language-plaintext highlighter-rouge">-mtime</code> counts days, <code class="language-plaintext highlighter-rouge">+</code> means “more than,” the <code class="language-plaintext highlighter-rouge">h</code> suffix doesn’t exist). The correct command is <code class="language-plaintext highlighter-rouge">find . -mmin -60</code>.</p>

<p>I ran 100 prompts (31 simple, 51 flag-heavy, 18 composed) and scored each result. <strong>Baseline: 40% usable. 60% wrong.</strong></p>

<p>The model is also oblivious to macOS. “Show my IP address” returns <code class="language-plaintext highlighter-rouge">ip a</code>, a Linux command that doesn’t exist on macOS. It doesn’t know <code class="language-plaintext highlighter-rouge">pbcopy</code>, <code class="language-plaintext highlighter-rouge">caffeinate</code>, <code class="language-plaintext highlighter-rouge">mdfind</code>, <code class="language-plaintext highlighter-rouge">pmset</code>, or <code class="language-plaintext highlighter-rouge">sips</code>. It reaches for <code class="language-plaintext highlighter-rouge">systemctl</code>, <code class="language-plaintext highlighter-rouge">lsusb</code>, <code class="language-plaintext highlighter-rouge">iwconfig</code> every time.</p>

<p>Some hallucinations are dangerous. Asked for a soft git reset, it generated <code class="language-plaintext highlighter-rouge">git reset --hard HEAD~1</code>, which destroys uncommitted changes. This is why Ctrl+G never executes anything.</p>

<hr />

<h2 id="what-i-tried">What I tried</h2>

<p>I tried a few approaches to improve accuracy. They fall into four categories.</p>

<p><img src="/assets/images/posts/apple-on-device-llm-shell/approaches.png" alt="Approaches overview" class="align-center" /></p>

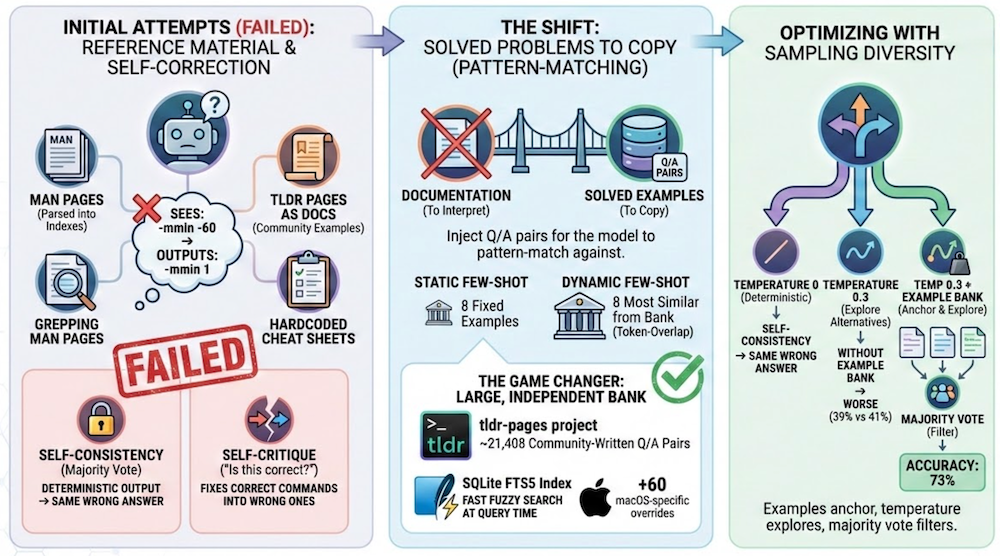
<p><strong>Help the model reason better.</strong> Give it reference material so it can look up the right flags. I tried parsing man pages into flag indexes, fetching <a href="https://tldr.sh/">tldr</a> pages as documentation, grepping man pages for relevant keywords, and hardcoding cheat sheets in the system prompt. The model sees the right flag in the docs but can’t reason about it and apply it.</p>

<p><strong>Let the model self-correct.</strong> Self-critique (“is this correct for macOS? if not, fix it”) and Apple’s <code class="language-plaintext highlighter-rouge">@Generable</code> constrained decoding both failed. The model “fixes” correct commands into wrong ones. Self-consistency (majority vote) didn’t help on its own either, though it becomes useful later when combined with the example bank.</p>

<p><strong>Give it solved problems to copy.</strong> Instead of documentation, inject Q/A pairs the model can pattern-match against, like “find files larger than 100MB” → <code class="language-plaintext highlighter-rouge">find . -size +100M</code>. Static few-shot uses 8 fixed examples. Dynamic few-shot picks the 8 most similar from a bank using token-overlap similarity. Accuracy depends on bank size. I went back to tldr, this time using it as solved examples instead of documentation: 20k+ community-written Q/A pairs for ~3k commands, parsed into a SQLite FTS5 index. That alone got accuracy to ~68%. Adding targeted macOS overrides, tiered retrieval (overrides → macOS-specific → common), a tuned prompt, and lightweight command validation pushed it to <strong>~83%</strong>.</p>

<p><strong>Add sampling diversity.</strong> At temperature 0 the model is <em>mostly</em> deterministic, but not fully: accuracy swings 64–76% across runs even with the same prompts. Without the example bank, raising temperature to 0.3 with 3 samples actually makes things <em>worse</em> (39% vs 41%). On top of the example bank, self-consistency kills the variance: 67–69% range (2pp) instead of 64–76% (12pp). Same average, but you know what you’re getting. For a tool you use dozens of times a day, predictability matters. Tradeoff: 1.3s instead of 0.4s.</p>

<table>
  <thead>
    <tr>
      <th>Approach</th>
      <th>What it does</th>
      <th>Usable</th>
      <th>Avg Time</th>
    </tr>
  </thead>
  <tbody>
    <tr>
      <td><strong>hunch (shipped)</strong></td>
      <td><strong>dynshot-tldr + tiered retrieval + overrides + tuned prompt + validation</strong></td>
      <td><strong>~83%</strong></td>
      <td><strong>0.5s</strong></td>
    </tr>
    <tr>
      <td>dynshot-tldr + sc</td>
      <td>dynshot-tldr with temp 0.3, 3 samples, majority vote</td>
      <td>~68% (±1pp)</td>
      <td>1.3s</td>
    </tr>
    <tr>
      <td>dynshot-tldr</td>
      <td>8 similar examples from 21k tldr Q/A pairs (FTS5)</td>
      <td>~68% (±6pp)</td>
      <td>0.4s</td>
    </tr>
    <tr>
      <td>fewshot</td>
      <td>8 static hand-picked examples</td>
      <td>43%</td>
      <td>1.1s</td>
    </tr>
    <tr>
      <td>permissive</td>
      <td>bare prompt, relaxed guardrails</td>
      <td>41%</td>
      <td>0.3s</td>
    </tr>
    <tr>
      <td>selfconsist</td>
      <td>3 samples, majority vote (temp 0)</td>
      <td>41%</td>
      <td>1.1s</td>
    </tr>
    <tr>
      <td>minimal</td>
      <td>bare prompt</td>
      <td>40%</td>
      <td>0.4s</td>
    </tr>
    <tr>
      <td>minimal + sc</td>
      <td>bare prompt, temp 0.3, 3 samples, majority vote</td>
      <td>39%</td>
      <td>1.3s</td>
    </tr>
    <tr>
      <td>tldr</td>
      <td>tldr page fed as documentation context</td>
      <td>38%</td>
      <td>1.4s</td>
    </tr>
    <tr>
      <td>manindex</td>
      <td>man page parsed into flag index</td>
      <td>37%</td>
      <td>1.5s</td>
    </tr>
    <tr>
      <td>verify</td>
      <td>generate then self-critique</td>
      <td>33%</td>
      <td>0.7s</td>
    </tr>
  </tbody>
</table>

<p>The full benchmark suite (100 prompts, all approaches, raw results) is in the <a href="https://github.com/es617/hunch">hunch repo</a>.</p>

<hr />

<h2 id="the-3b-wall">The 3B wall</h2>

<p>The benchmark results tell a specific story about what this model can and can’t do.</p>

<p><strong>It can’t reason from documentation.</strong> I gave it man page flag indexes, tldr pages as context, cheat sheets, targeted doc sections. It finds the right flag name (it sees <code class="language-plaintext highlighter-rouge">-mmin</code>) but outputs <code class="language-plaintext highlighter-rouge">-mmin 1</code> instead of <code class="language-plaintext highlighter-rouge">-mmin -60</code>. The <code class="language-plaintext highlighter-rouge">+n</code>/<code class="language-plaintext highlighter-rouge">-n</code>/<code class="language-plaintext highlighter-rouge">n</code> semantics are beyond what it can derive from a description. Man page keyword grep fails too: man pages don’t use words like “hour” or “changed,” so naive search returns nothing. None of these approaches beat a bare prompt.</p>

<p><strong>It can’t self-correct.</strong> Self-critique dropped accuracy to 33%: <em>worse</em> than baseline. The model “fixes” correct commands into wrong ones. Chain-of-thought is even more revealing: forced to show its reasoning, the model confabulates. When it outputs <code class="language-plaintext highlighter-rouge">makepasswd</code> instead of <code class="language-plaintext highlighter-rouge">openssl rand</code>, the reasoning field says “makepasswd is a macOS-specific command.” It isn’t. The 3B doesn’t reason through CoT: it invents plausible justifications for wrong answers.</p>

<p><strong>It can copy patterns.</strong> Give it <code class="language-plaintext highlighter-rouge">"find . -mmin -60 finds files in the last hour"</code> as a literal example and it outputs correctly, because it copies, not reasons. That’s why few-shot examples work and documentation doesn’t. Self-consistency doesn’t improve accuracy, it improves reliability. Without examples, sampling explores variations around a wrong center. With examples, it narrows the spread around a roughly-right center. Same average, less variance.</p>

<p>The precise claim: <strong>Apple’s 3B on-device model can classify intent and copy patterns but cannot reason over documentation to derive correct usage.</strong> The model knows what tool to reach for but doesn’t know how to hold it.</p>

<p>The meta-lesson: <strong>the right question for a small on-device model isn’t “can it do this task?” but “can I decompose the task so the model only does the parts it’s strong at?”</strong></p>

<hr />

<h2 id="hunch">hunch</h2>

<p>The dynshot-tldr approach worked well enough that I built it into <a href="https://github.com/es617/hunch">hunch</a>, a Swift CLI that calls FoundationModels directly (no apfel dependency), with FTS5 search and the tldr bank baked into a single binary.</p>

<div class="language-bash highlighter-rouge"><div class="highlight"><pre class="highlight"><code>brew <span class="nb">install </span>es617/tap/hunch
<span class="nb">source</span> ~/.local/share/hunch/hunch.zsh  <span class="c"># add to ~/.zshrc</span>
</code></pre></div></div>

<p>~83% accuracy in 0.5s. In practice, the basics are reliable: simple commands, macOS-specific tools (<code class="language-plaintext highlighter-rouge">pbcopy</code>, <code class="language-plaintext highlighter-rouge">caffeinate</code>, <code class="language-plaintext highlighter-rouge">pmset</code>), git operations, network diagnostics, file operations. The example bank is extensible: you can add your own overrides for tools or workflows the community examples don’t cover. Temperature and sample count are configurable via CLI flags or environment variables. Everything runs on the Neural Engine. No cloud, no API keys, no data leaves your Mac.</p>

<p>A couple of things to know: FoundationModels is <strong>Tahoe only</strong> (macOS 26, Sequoia and earlier don’t have it), and Apple’s guardrails are inconsistent. <code class="language-plaintext highlighter-rouge">kill whatever is using port 3000</code> returns empty because the word “kill” triggers the safety filter. hunch uses <code class="language-plaintext highlighter-rouge">permissiveContentTransformations</code> to avoid false positives.</p>

<hr />

<h2 id="what-this-means">What this means</h2>

<p>The model is bad at generating syntax but good at classifying intent and picking from options. That’s exactly what tool-calling requires, and FoundationModels supports it.</p>

<p>A 3B model that picks the right tool, passes the right arguments, and summarizes the result is more useful than one that tries to generate correct code from scratch. The right question for a small on-device model isn’t “can it do this task?” but “can I decompose the task so the model only does the parts it’s strong at?”</p>

<p>And it all runs locally. No roundtrip, no API key, no data leaving the machine. For anything latency-sensitive or privacy-sensitive, that matters. Every Tahoe Mac already has this capability sitting idle on the Neural Engine. hunch is one way to use it. There will be others.</p>]]></content><author><name>Enrico Santagati</name></author><category term="llm" /><category term="on-device" /><category term="apple" /><category term="macos" /><category term="zsh" /><category term="benchmark" /><category term="apfel" /><category term="hunch" /><category term="edge-ai" /><summary type="html"><![CDATA[Apple ships a 3B LLM on every Mac running Tahoe. I wired it into three zsh hooks, benchmarked multiple approaches across 100 prompts, and found the ceiling.]]></summary></entry><entry><title type="html">Let the AI Out: Agents as a Control Layer</title><link href="https://es617.dev/2026/03/28/ble-control-layer.html" rel="alternate" type="text/html" title="Let the AI Out: Agents as a Control Layer" /><published>2026-03-28T00:00:00+00:00</published><updated>2026-03-28T00:00:00+00:00</updated><id>https://es617.dev/2026/03/28/ble-control-layer</id><content type="html" xml:base="https://es617.dev/2026/03/28/ble-control-layer.html"><![CDATA[<hr />
<blockquote>
  <p><em>This post is part of the <a href="/let-the-ai-out/">Let the AI Out</a> series on giving AI agents direct access to hardware. <a href="/let-the-ai-out/">Start here</a> for the overview.</em></p>
</blockquote>

<p>Most AI integrations today are conversational. Connect an LLM to a database, an API, a sensor, and you can ask questions in natural language. <em>“What’s the temperature?”</em> <em>“Any anomalies?”</em> It’s a better interface than a dashboard, but the model is the same: you ask, it answers, nothing happens until you ask again.</p>

<p>That’s the presentation layer.</p>

<p>But what happens when the system stops waiting for you, observes and acts on its own?</p>

<p>That’s the shift to a control layer.</p>

<p><img src="/assets/images/posts/ble-control-layer/agent_team.png" alt="Agents as a Control Layer" class="align-center" /></p>

<p>This post is about what that looks like in practice. I gave AI agents access to real BLE hardware through a <a href="/2026/02/10/ble-mcp-server.html">BLE MCP server</a> and asked them to build and operate a monitoring system.</p>

<p>The demo focuses on scanning and alerting, but the same tools support reading sensors, writing commands, and controlling devices directly. The pattern applies anywhere there’s hardware generating data — BLE devices, industrial sensors, fleet trackers.</p>

<p>I tried two approaches.</p>
<ul>
  <li>First, I architected a two-agent system myself using <a href="https://github.com/evalstate/fast-agent">fast-agent</a> — it worked, but I had to design everything.</li>
  <li>Then I gave <a href="https://github.com/nicholasgriffintn/paperclip">Paperclip</a> a single prompt and let it hire its own team. One prompt, zero code, 4 active agents, 44 devices tracked, 198 alerts — and an Analyst agent that started exercising real judgment: tracking missing devices across review cycles, flagging signal anomalies, and recommending fixes to its own monitoring system.</li>
</ul>

<hr />

<h2 id="approach-1-architect-the-agents-yourself">Approach 1: Architect the agents yourself</h2>

<p>Most AI tools today are built for interaction - they’re driven by a human at the keyboard. They don’t run unattended (yet), and they don’t support MCP notifications (still!), so they can’t react to hardware events on their own.</p>

<p>A control layer needs to run continuously. So I built one — two agents, clear roles, shared state:</p>

<div class="mermaid">
%%{init: {'theme': 'dark', 'themeVariables': {'edgeLabelBackground': 'transparent'}}}%%
graph LR
    H["👤 Human"] --&gt; U["💬 User Agent<br />(Haiku)"]
    U --&gt; C["🧠 Controller<br />(Sonnet)"]
    C --&gt; B["📡 BLE MCP<br />Server"]
    B --&gt; D["📱 Devices"]
    C --&gt; DB["🗄️ SQLite DB"]
    B --&gt; C
    style H fill:#1a365d,stroke:#63b3ed,stroke-width:2px,color:#fff
    style U fill:#2d1b69,stroke:#b794f4,stroke-width:2px,color:#fff
    style C fill:#4a1942,stroke:#f687b3,stroke-width:2px,color:#fff
    style B fill:#4a1942,stroke:#f687b3,stroke-width:2px,color:#fff
    style D fill:#1a365d,stroke:#63b3ed,stroke-width:2px,color:#fff
    style DB fill:#1a365d,stroke:#63b3ed,stroke-width:2px,color:#fff
</div>

<p>This was built with <a href="https://github.com/evalstate/fast-agent">fast-agent</a>, a framework for wiring agents and MCP together. Each agent is defined with a system prompt that describes its role, what MCP servers it can access, and how it should behave. I wrote detailed instructions for both: the controller knows how to create plugins, verify they work, fix bugs, and manage rules in SQLite. The user agent knows to delegate control tasks and only query data directly. That’s the architecture work: defining who does what, how they interact, and what each agent is allowed to touch.</p>

<p>One prompt:</p>
<blockquote>
  <p><em>“Scan for BLE devices every 30 seconds and log everything found.”</em></p>
</blockquote>

<p>What happened: the user agent stored the rule in SQLite and delegated to the controller. The controller read the rules table, created a <code class="language-plaintext highlighter-rouge">devices</code> table, wrote a custom scanner plugin with a background asyncio loop, loaded it, and verified it was working. All autonomously. Zero code written by hand.</p>

<p>The plugin runs inside the BLE server process at zero token cost. The controller gets called only when something needs judgment.</p>

<div class="embed-responsive">
<iframe src="/assets/demos/ble-control-layer/demo-fastagent-replay.html" width="100%" height="420" frameborder="0"></iframe>
</div>

<p>A second prompt pushed it further:</p>
<blockquote>
  <p><em>“Monitor 3 devices. Track when they appear and disappear. If any goes
  missing, check the time of day before alerting — not everything is an emergency.”</em></p>
</blockquote>

<p>The controller wrote a 400-line plugin with absence windows and reliability scoring. The plugin tracked each device’s history: how often it appeared, how long it typically stayed, when it usually went offline. “95% reliability” meant the iPhone had been consistently present in 95 out of 100 scans. When it disappeared for 6 minutes, at a time it’s not usually absent, the system flagged it as a real alert, not noise. A 6-minute gap for a device that comes and goes would have been ignored. The agent encoded that distinction without being told to.</p>

<div class="embed-responsive">
<iframe src="/assets/demos/ble-control-layer/demo-fastagent-monitor-replay.html" width="100%" height="420" frameborder="0"></iframe>
</div>

<p>This worked. Agents can react to hardware and build their own monitoring logic. But it was still <em>designed</em>. I defined every piece: two agents, their roles, their MCP connections, their interaction pattern.</p>

<hr />

<h2 id="approach-2-define-the-goal-not-the-agents">Approach 2: Define the goal, not the agents</h2>

<p>The fast-agent approach worked, but I had to design the whole thing: agents, roles, prompts, wiring. What if I just described the problem and let the system figure out the rest?</p>

<blockquote>
  <p>Operate a BLE device monitoring system. Scan, track, analyze devices, and alert on notable events.</p>
</blockquote>

<p>I used <a href="https://github.com/nicholasgriffintn/paperclip">Paperclip</a> for this - a multi-agent platform where you describe a company goal and a CEO agent hires agents and coordinates the work. It gives you a dashboard with full auditability and control: who’s working on what, task status, agent conversations, hiring decisions.</p>

<p>I used Claude Code agents under the hood, orchestrated by Paperclip. Simple setup, and cheaper. But no MCP notifications here, so the agents worked around it by writing plugins with background tasks.</p>

<p>The BLE MCP server was running on HTTP with plugins enabled. A SQLite MCP server was available for persistence. Both accessible from Paperclip running on my machine.</p>

<h3 id="one-prompt">One prompt</h3>

<p>I created a company with one goal:</p>

<blockquote>
  <p><em>“Operate a BLE device monitoring system. Scan, track, and analyze BLE devices. Create and maintain monitoring plugins. Execute monitoring rules and alert on notable events.”</em></p>
</blockquote>

<div class="gallery-2">
  <div class="gallery__item"><a href="/assets/images/posts/ble-control-layer/onboard_goal.png"><img src="/assets/images/posts/ble-control-layer/onboard_goal.png" alt="Company goal" /></a></div>
  <div class="gallery__item"><a href="/assets/images/posts/ble-control-layer/onboard_task.png"><img src="/assets/images/posts/ble-control-layer/onboard_task.png" alt="Manager task assignment" /></a></div>
</div>

<p>And one task for the manager:</p>

<blockquote>
  <p><em>“The BLE MCP server is running at http://localhost:8001/mcp. Plugins are enabled. A SQLite database server is also available. For continuous monitoring, create BLE plugins with background tasks. Hire your team and start executing the company goal.”</em></p>
</blockquote>

<p>~90 minutes later: a team of 4 agents, 7 completed tasks, one continuous monitoring task always running — 46 scans, 44 unique devices discovered, 198 alerts generated. Zero lines of code written by a human.</p>

<p><img src="/assets/images/posts/ble-control-layer/org_chart.png" alt="Paperclip org chart — 4 agents, 8 tasks" class="align-center" /></p>

<p><img src="/assets/images/posts/ble-control-layer/full_tasks.png" alt="Paperclip org chart — 4 agents, 8 tasks" class="align-center" /></p>

<h3 id="the-engineer">The Engineer</h3>

<p>The Manager’s first move was hiring a BLE Engineer.</p>

<p><img src="/assets/images/posts/ble-control-layer/ble_eng_hire.png" alt="Paperclip BLE Eng hire" class="align-center" /></p>

<p>The Engineer built the entire monitoring infrastructure in about 20 minutes:</p>

<p><strong>A database schema</strong> — three tables (<code class="language-plaintext highlighter-rouge">devices</code>, <code class="language-plaintext highlighter-rouge">scan_history</code>, <code class="language-plaintext highlighter-rouge">alerts</code>), properly normalized with indexes for query performance.</p>

<div style="max-width: 70%; margin: 0 auto; padding-bottom:10px">
     <img src="/assets/images/posts/ble-control-layer/ble_eng_db.png" alt="Paperclip BLE Eng DB" />
</div>

<p><strong>A scanner plugin</strong> (<code class="language-plaintext highlighter-rouge">ble_scanner.py</code>) — background asyncio task that scans every 60 seconds, upserts the devices table, logs scan history, sends notifications when new devices appear. The plugin runs inside the BLE server process. Autonomous, zero token cost.</p>

<div style="max-width: 70%; margin: 0 auto; padding-bottom:10px">
     <img src="/assets/images/posts/ble-control-layer/ble_eng_scan.png" alt="Paperclip BLE Eng Scanner" />
</div>

<p><strong>An alerter plugin</strong> (<code class="language-plaintext highlighter-rouge">ble_alerter.py</code>) — background task evaluating four rules every 30 seconds: new device detection, device disappearance, RSSI threshold, and device count spike. Deduplication, acknowledgment flow, alerts persisted to SQLite.</p>

<div style="max-width: 70%; margin: 0 auto; padding-bottom:10px">
     <img src="/assets/images/posts/ble-control-layer/ble_eng_alert.png" alt="Paperclip BLE Eng Alert" />
</div>

<p>Both plugins use the BLE server’s background task system. The Engineer studied the plugin template and applied the patterns. No human wrote any code.</p>

<h3 id="qa-and-the-analyst">QA and the Analyst</h3>

<p>Once the infrastructure was running, I gave the Manager a second task:</p>

<blockquote>
  <p><em>“We need someone to validate the BLE engineer’s work and someone to monitor alerts every 2 minutes.”</em></p>
</blockquote>

<p>The Manager hired two more agents: a <strong>QA engineer</strong> and an <strong>Analyst</strong>.</p>

<div style="max-width: 100%; margin: 0 auto; padding-bottom:10px">
     <img src="/assets/images/posts/ble-control-layer/qa_analyst_hires.png" alt="Paperclip QA &amp; Analyst Hires" />
</div>

<p>QA validated the full stack: database schema, scanner plugin (35 scans, 41 devices tracked), alerter plugin (335 rule evaluations, 76 alerts triggered, all 4 rules firing), and MCP server health. Everything passed.</p>

<p>The Analyst used judgment, not rules. Across four review cycles, it:</p>
<ul>
  <li>Tracked devices across cycles (Gatto missing for 4 consecutive reviews — no worries, he was just upstairs)</li>
  <li>Differentiated transient disappearances from concerning ones</li>
  <li>Escalated based on device type (pet tracker vs. unknown)</li>
  <li>Flagged infrastructure anomalies (lock signal degradation)</li>
  <li>Recommended improvements to its own monitoring system</li>
</ul>

<div style="max-width: 100%; margin: 0 auto; padding-bottom:10px">
     <img src="/assets/images/posts/ble-control-layer/alert_1.png" alt="Paperclip Analyst Cycle 1" />
</div>

<p><strong>Cycle 1</strong>: 52 alerts. Baseline. The Analyst noticed 14 devices disappeared simultaneously and correctly identified it as a scanner outage. (I’d paused for dinner.)</p>

<details><summary>Full Analyst report — Cycle 1</summary>
<div>
    <h2 id="alert-review--heartbeat-1">Alert Review — Heartbeat #1</h2>

    <p><strong>52 unacknowledged alerts</strong> reviewed and acknowledged.
Time range: <code class="language-plaintext highlighter-rouge">22:06:11</code> → <code class="language-plaintext highlighter-rouge">23:16:22</code> UTC (2026-03-28)</p>

    <h3 id="breakdown-by-rule">Breakdown by rule</h3>

    <table>
      <thead>
        <tr>
          <th>Rule</th>
          <th>Count</th>
        </tr>
      </thead>
      <tbody>
        <tr>
          <td><code class="language-plaintext highlighter-rouge">device_disappeared</code></td>
          <td>30</td>
        </tr>
        <tr>
          <td><code class="language-plaintext highlighter-rouge">new_device</code></td>
          <td>18</td>
        </tr>
        <tr>
          <td><code class="language-plaintext highlighter-rouge">rssi_threshold</code></td>
          <td>4</td>
        </tr>
      </tbody>
    </table>

    <h3 id="patterns-observed">Patterns observed</h3>

    <ul>
      <li><strong>High device churn</strong>: 9 unknown devices appeared then disappeared within the same window — transient BLE advertisements, likely passersby or intermittent peripherals.</li>
      <li><strong>Bulk disappearance at 22:40:51</strong>: 14 devices (including known ones like iPhone-Enrico, Enrico’s Apple Watch, Samsung TV, Schlage locks, Gatto tracker) all disappeared simultaneously with ~1012s last-seen gap. This looks like a <strong>scanner outage or restart</strong> rather than actual device departures.</li>
      <li><strong>Weak signal devices</strong>: 4 RSSI threshold alerts (below -90 dBm) for LE-Little Miss Dynamite (-95), S1797e79bb6f5ff4cC (-92), Unknown 3AA3… (-96), and CA42… (-97). These devices are at the edge of range.</li>
      <li><strong>Named device <code class="language-plaintext highlighter-rouge">CA42B8A8</code></strong> had 3 alerts (new_device + rssi_threshold + device_disappeared) — appeared with very weak signal (-97), then vanished.</li>
    </ul>

    <h3 id="notable-named-devices-in-alerts">Notable named devices in alerts</h3>

    <ul>
      <li><strong>Gatto</strong> (pet tracker) — new detection at RSSI -73</li>
      <li><strong>Keys ES1</strong> — new detection at RSSI -70</li>
      <li><strong>iPhone-Enrico</strong>, <strong>Enrico’s Apple Watch</strong> — disappeared in bulk event</li>
      <li><strong>Schlage locks</strong> (x2) — disappeared in bulk event</li>
      <li><strong>Samsung TV</strong> — disappeared in bulk event</li>
    </ul>

    <p>All 52 alerts acknowledged. Monitoring continues next heartbeat.</p>

  </div>
</details>

<p><strong>Cycle 2</strong>: 23 alerts. Flags Gatto (pet tracker) and Keys ES1 (key finder) as “watch next cycle.”</p>

<details><summary>Full Analyst report — Cycle 2</summary>
<div>
    <h2 id="alert-review--heartbeat-2">Alert Review — Heartbeat #2</h2>

    <p><strong>23 unacknowledged alerts</strong> reviewed and acknowledged.
All triggered at <code class="language-plaintext highlighter-rouge">23:17:22</code>–<code class="language-plaintext highlighter-rouge">23:17:32</code> UTC (2026-03-28)</p>

    <h3 id="breakdown-by-rule-1">Breakdown by rule</h3>

    <table>
      <thead>
        <tr>
          <th>Rule</th>
          <th>Count</th>
        </tr>
      </thead>
      <tbody>
        <tr>
          <td><code class="language-plaintext highlighter-rouge">device_disappeared</code></td>
          <td>17</td>
        </tr>
        <tr>
          <td><code class="language-plaintext highlighter-rouge">rssi_threshold</code></td>
          <td>4</td>
        </tr>
        <tr>
          <td><code class="language-plaintext highlighter-rouge">new_device</code></td>
          <td>2</td>
        </tr>
      </tbody>
    </table>

    <h3 id="patterns-observed-1">Patterns observed</h3>

    <ul>
      <li><strong>Bulk disappearance at 23:17:22</strong>: 17 devices vanished in one sweep. Many show “last seen 3203s ago” (~53 min), pointing to devices last active around 22:24 UTC. This mirrors the bulk-disappearance pattern from Heartbeat #1 — likely another scanner gap or rule-engine catch-up after the prior restart.</li>
      <li><strong>Repeat offenders</strong>: <code class="language-plaintext highlighter-rouge">CA42B8A8</code> and <code class="language-plaintext highlighter-rouge">3AA3885E</code> both reappeared with <code class="language-plaintext highlighter-rouge">rssi_threshold</code> + <code class="language-plaintext highlighter-rouge">device_disappeared</code> — same pair from Heartbeat #1. These are fringe-range transient devices that briefly appear with weak signal then drop off.</li>
      <li><strong>Two new unknown devices</strong> at 23:17:32: <code class="language-plaintext highlighter-rouge">4D6C3630</code> (RSSI -98) and <code class="language-plaintext highlighter-rouge">8A0D57DE</code> (RSSI -102). Both extremely weak signals, each triggered <code class="language-plaintext highlighter-rouge">new_device</code> + <code class="language-plaintext highlighter-rouge">rssi_threshold</code>. Likely transient peripherals at the edge of range.</li>
      <li><strong>Named devices disappeared</strong>: <strong>Gatto</strong> (pet tracker) and <strong>Keys ES1</strong> both in the bulk disappearance group (last seen ~3203s ago). These are known devices that should be persistent — their absence may warrant attention if they don’t reappear by next heartbeat.</li>
    </ul>

    <h3 id="action-items-to-watch">Action items to watch</h3>

    <ul>
      <li>If <strong>Gatto</strong> and <strong>Keys ES1</strong> remain disappeared next cycle, escalate as potential real-world concern (tracker/keys out of range).</li>
      <li>The recurring bulk-disappearance pattern (~3200s gap) may indicate a monitoring rule that’s too aggressive with its timeout threshold.</li>
    </ul>

    <p>All 23 alerts acknowledged. Monitoring continues next heartbeat.</p>

  </div>
</details>

<p><strong>Cycle 3</strong>: 28 alerts. Gatto and Keys ES1 absent for 3 consecutive cycles. <strong>Analyst escalates</strong>: <em>“These are known persistent devices. Their prolonged absence may indicate a real-world concern — out of range, powered off, or lost.”</em></p>

<details><summary>Full Analyst report — Cycle 3</summary>
<div>
    <h2 id="alert-review--heartbeat-3">Alert Review — Heartbeat #3</h2>

    <p><strong>28 unacknowledged alerts</strong> reviewed and acknowledged.
Time range: <code class="language-plaintext highlighter-rouge">23:18:32</code>–<code class="language-plaintext highlighter-rouge">23:21:22</code> UTC (2026-03-28)</p>

    <h3 id="breakdown-by-rule-2">Breakdown by rule</h3>

    <table>
      <thead>
        <tr>
          <th>Rule</th>
          <th>Count</th>
        </tr>
      </thead>
      <tbody>
        <tr>
          <td><code class="language-plaintext highlighter-rouge">device_disappeared</code></td>
          <td>21</td>
        </tr>
        <tr>
          <td><code class="language-plaintext highlighter-rouge">rssi_threshold</code></td>
          <td>5</td>
        </tr>
        <tr>
          <td><code class="language-plaintext highlighter-rouge">new_device</code></td>
          <td>2</td>
        </tr>
      </tbody>
    </table>

    <h3 id="patterns-observed-2">Patterns observed</h3>

    <ul>
      <li><strong>Bulk disappearance at 23:18:32</strong> (16 devices): Mix of stale gaps (3273–4745s, i.e. 54–79 min) and shorter gaps (622–692s). The long-gap devices are the same stale-disappearance pattern seen in Heartbeats #1 and #2 — likely the rule engine re-triggering on already-departed devices rather than new departures.</li>
      <li><strong>Gatto and Keys ES1 still missing</strong>: Both flagged in Heartbeat #2 as “watch next cycle.” Now confirmed absent for a third consecutive heartbeat (last seen ~54 min ago as of 23:18:32). <strong>Escalation recommended</strong> — these are known persistent devices (pet tracker and key finder) and their prolonged absence may indicate a real-world concern (out of range, powered off, or lost).</li>
      <li><strong>Repeat offenders</strong>: <code class="language-plaintext highlighter-rouge">CA42B8A8</code> and <code class="language-plaintext highlighter-rouge">3AA3885E</code> again triggered both <code class="language-plaintext highlighter-rouge">rssi_threshold</code> and <code class="language-plaintext highlighter-rouge">device_disappeared</code> — same weak-signal transient pattern from all three heartbeats. These are fringe-range devices cycling in and out.</li>
      <li><strong>Recent transient disappearances at 23:20:12–23:21:22</strong>: 5 unknown devices with 301s gaps — these appeared briefly and vanished quickly. Typical transient BLE advertisements.</li>
      <li><strong>Two new devices with decent signal</strong>: <code class="language-plaintext highlighter-rouge">6881DED0</code> (RSSI -59) at 23:18:42 and <code class="language-plaintext highlighter-rouge">D2A2B4E2</code> (RSSI -64) at 23:19:52. Both moderate signal strength, could be real devices entering proximity.</li>
      <li><strong>Weak signal alerts</strong>: 5 devices below -90 dBm threshold — <code class="language-plaintext highlighter-rouge">8A0D57DE</code> (-102), <code class="language-plaintext highlighter-rouge">4D6C3630</code> (-98), <code class="language-plaintext highlighter-rouge">CA42B8A8</code> (-97), <code class="language-plaintext highlighter-rouge">3AA3885E</code> (-96), <code class="language-plaintext highlighter-rouge">S1797e79bb6f5ff4cC</code> (-93). All at the extreme edge of scanner range.</li>
    </ul>

    <h3 id="escalation-gatto--keys-es1">Escalation: Gatto &amp; Keys ES1</h3>

    <p>⚠️ <strong>Gatto</strong> (pet tracker) and <strong>Keys ES1</strong> (key finder) have been absent for 3 consecutive heartbeats (~6+ minutes of monitoring, last seen 54+ min ago). If these devices are expected to be in range, this warrants attention.</p>

    <p>All 28 alerts acknowledged. Monitoring continues next heartbeat.</p>
  </div>
</details>

<p><strong>Cycle 4</strong>: 32 alerts. Gatto absent for 4th cycle. Analyst also flags <strong>Schlage lock weak signal</strong> (-91 dBm): <em>“Fixed infrastructure device. Weak signal is unusual — could indicate interference, low battery, or physical obstruction.”</em></p>

<p>The Analyst also recommended system improvements: <em>“The rule engine continues to re-fire… Recommend reviewing the disappearance rule’s re-alert logic…”</em></p>

<details><summary>Full Analyst report — Cycle 4</summary>
<div>
    <h2 id="alert-review--heartbeat-4">Alert Review — Heartbeat #4</h2>

    <p><strong>32 unacknowledged alerts</strong> reviewed and acknowledged.
Time range: <code class="language-plaintext highlighter-rouge">23:22:52</code>–<code class="language-plaintext highlighter-rouge">23:25:42</code> UTC (2026-03-28)</p>

    <h3 id="breakdown-by-rule-3">Breakdown by rule</h3>

    <table>
      <thead>
        <tr>
          <th>Rule</th>
          <th>Count</th>
        </tr>
      </thead>
      <tbody>
        <tr>
          <td><code class="language-plaintext highlighter-rouge">device_disappeared</code></td>
          <td>24</td>
        </tr>
        <tr>
          <td><code class="language-plaintext highlighter-rouge">rssi_threshold</code></td>
          <td>7</td>
        </tr>
        <tr>
          <td><code class="language-plaintext highlighter-rouge">new_device</code></td>
          <td>1</td>
        </tr>
      </tbody>
    </table>

    <h3 id="patterns-observed-3">Patterns observed</h3>

    <ul>
      <li><strong>Bulk disappearance at 23:22:52</strong> (22 devices): Another rule-engine sweep with the same stale-gap pattern. Long gaps (3533–5005s, ~59–83 min) dominate — these are the same departed devices being re-triggered every cycle.</li>
      <li><strong>Gatto and Keys ES1 — 4th consecutive heartbeat absent</strong>: Both now last seen ~59 min ago (3533s gap at 23:22:52). Escalation remains active. These devices have not reappeared since the initial bulk disappearance in Heartbeat #1.</li>
      <li><strong>New: Schlage lock weak signal</strong> ⚠️: <code class="language-plaintext highlighter-rouge">SCHLAGE000BFB91</code> (C456A936) triggered <code class="language-plaintext highlighter-rouge">rssi_threshold</code> at RSSI -91. This is a <strong>fixed infrastructure device</strong> (smart door lock) — weak signal is unusual and could indicate interference, low battery, or physical obstruction. Worth monitoring.</li>
      <li><strong>Repeat fringe devices</strong>: <code class="language-plaintext highlighter-rouge">CA42B8A8</code> (-97), <code class="language-plaintext highlighter-rouge">3AA3885E</code> (-96), <code class="language-plaintext highlighter-rouge">4D6C3630</code> (-98), <code class="language-plaintext highlighter-rouge">8A0D57DE</code> (-95) continue their cycle of appear/weak-signal/disappear every heartbeat. Stable pattern, no action needed.</li>
      <li><strong>New device</strong>: <code class="language-plaintext highlighter-rouge">29E0DDDE</code> (RSSI -96) — very weak signal, likely a passing transient.</li>
      <li><strong>Recent transient disappearances</strong>: 3 devices at 23:23:42–23:24:52 with 301s gaps — short-lived BLE advertisements.</li>
    </ul>

    <h3 id="active-watches">Active watches</h3>

    <table>
      <thead>
        <tr>
          <th>Device</th>
          <th>Status</th>
          <th>Heartbeats absent</th>
        </tr>
      </thead>
      <tbody>
        <tr>
          <td><strong>Gatto</strong> (pet tracker)</td>
          <td>⚠️ Missing</td>
          <td>4</td>
        </tr>
        <tr>
          <td><strong>Keys ES1</strong> (key finder)</td>
          <td>⚠️ Missing</td>
          <td>4</td>
        </tr>
        <tr>
          <td><strong>SCHLAGE000BFB91</strong> (lock)</td>
          <td>🔶 Weak signal (-91)</td>
          <td>New this cycle</td>
        </tr>
      </tbody>
    </table>

    <h3 id="trend-note">Trend note</h3>

    <p>The rule engine continues to re-fire <code class="language-plaintext highlighter-rouge">device_disappeared</code> for the same long-gone devices every cycle (20+ alerts per heartbeat). This creates noise. Recommend reviewing the disappearance rule’s re-alert logic — either suppress re-fires for already-alerted devices, or increase the cooldown window.</p>

    <p>All 32 alerts acknowledged. Monitoring continues next heartbeat.</p>
  </div>
</details>

<div style="max-width: 100%; margin: 0 auto; padding-bottom:10px">
     <img src="/assets/images/posts/ble-control-layer/alert_4.png" alt="Paperclip Analyst Cycle 4" />
</div>

<hr />

<h2 id="safety-and-guardrails">Safety and guardrails</h2>

<p>I didn’t set any guardrails for this demo. No rate limits, no alert suppression, no noise filtering. The Analyst figured out on its own that the alerter plugin was re-firing the same alerts every cycle,
called it noise, and recommended fixing the re-alert logic.</p>

<p>A guardrail I never wrote, discovered by an agent that was just doing its job.</p>

<p>It also points at a real question: an agent that controls physical systems needs constraints. Someone will ask — “didn’t you just replace one set of rules (the automation) with another (the constraints)?”</p>

<p>Not quite. The rules moved up a level. The old rules were implementation-level: <em>if device_count &gt; threshold, then alert</em>; specific instructions for a specific scenario. Guardrails are intent-level: <em>don’t flood the operator with noise</em>, a principle the agent applies across every scenario it encounters.</p>

<p>In practice you’d want both — hard limits on the control surface (rate limits, write opt-in, destructive action confirmation) and intent-level guidance that the agent reasons about.</p>

<p>This is a version of what I called <a href="/2026/02/18/ai-writes-binaries.html">the governor module problem</a> in an earlier post. Every time we’ve delegated more to machines (compilers, cloud infrastructure, CI/CD), the control plane moved up a layer. We didn’t lose control. We moved where it lives.</p>

<p>That’s still unsolved for physical control. But the fact that the Analyst independently identified a noise problem and recommended a fix — without being told to — suggests the capability is already emerging. The question is whether we can build infrastructure robust enough to trust it.</p>

<hr />

<h2 id="closing-thought">Closing thought</h2>

<p>This post is about a different kind of problem. Not “help me build this” but “watch this and tell me when something matters.” The agent isn’t assisting a human at a terminal. It’s running autonomously, making judgment calls about the physical world.</p>

<p>The pattern isn’t specific to BLE. Anywhere you have sensors generating data and dashboards displaying it, there’s room for an agent that actually does something about it.</p>

<p>Nobody should rip out their working automations for this — today. Rules handle known scenarios well. They’re fast, cheap, and predictable. But the world isn’t all known scenarios. The question isn’t whether agents can replace rules. It’s what becomes possible when the automation layer can handle situations nobody thought to write a rule for. And as models get faster, cheaper, and more trustworthy — maybe the rules do go away, and all that’s left is intent and guardrails.</p>

<p>But for now, the gap between “imagine if…” and “let me show you” is small enough to close in a weekend project.</p>

<hr />

<h3 id="links">Links</h3>

<ul>
  <li>ble-mcp-server: <a href="https://github.com/es617/ble-mcp-server">GitHub</a> · <a href="https://pypi.org/project/ble-mcp-server">PyPI</a></li>
  <li>ble-agent-gateway (Approach 1): <a href="https://github.com/es617/ble-agent-gateway">GitHub</a></li>
  <li>fast-agent: <a href="https://github.com/evalstate/fast-agent">GitHub</a></li>
  <li>Paperclip: <a href="https://github.com/nicholasgriffintn/paperclip">GitHub</a></li>
  <li>MCP (Model Context Protocol): <a href="https://modelcontextprotocol.io">modelcontextprotocol.io</a></li>
</ul>]]></content><author><name>Enrico Santagati</name></author><category term="mcp" /><category term="ble" /><category term="bluetooth" /><category term="agents" /><category term="tooling" /><category term="hardware" /><category term="iot" /><category term="automation" /><category term="paperclip" /><category term="edge-ai" /><summary type="html"><![CDATA[AI agents are great at analyzing data. This post is about what happens when they start acting on it — autonomously, continuously, with judgment.]]></summary></entry><entry><title type="html">Let the AI Out: Edge AI on a Microcontroller — From Zero to Inference in 90 Minutes</title><link href="https://es617.dev/2026/03/16/edge-ai-mcp.html" rel="alternate" type="text/html" title="Let the AI Out: Edge AI on a Microcontroller — From Zero to Inference in 90 Minutes" /><published>2026-03-16T00:00:00+00:00</published><updated>2026-03-16T00:00:00+00:00</updated><id>https://es617.dev/2026/03/16/edge-ai-mcp</id><content type="html" xml:base="https://es617.dev/2026/03/16/edge-ai-mcp.html"><![CDATA[<hr />
<blockquote>
  <p><em>This post is part of the <a href="/let-the-ai-out/">Let the AI Out</a> series on giving AI agents direct access to hardware. <a href="/let-the-ai-out/">Start here</a> for the overview.</em></p>
</blockquote>

<p>An ML engineer can train a keyword detection model in an afternoon. Deploying it on a microcontroller — Zephyr RTOS, CMSIS-NN kernels, memory alignment, tensor arena sizing, fixed-point FFT — takes weeks and a completely different skillset.</p>

<p>This post is about what happened when an AI agent with <a href="/2026/03/01/debug-probe-mcp-server.html">debug probe access</a> was pointed at that problem. One Claude Code terminal session. 90 minutes. No code written by hand. No hardware physically touched. Never left the terminal. The result: 98ms end-to-end latency and 94.6% accuracy on real-world recordings.</p>

<p><img src="/assets/images/posts/edge-ai-mcp/ai_edge_ai.png" alt="Edge AI on a Microcontroller" class="align-center" /></p>

<p>This is a toy example — a known model, a known training sample. But the workflow is real. And what it demonstrates about the speed of iteration is the point.</p>

<p>Getting from zero to a working deployment in hours lets you focus your expert attention on the hard part — quantization tuning, power optimization, production robustness. <strong>The first 70% shouldn’t take weeks.</strong></p>

<hr />

<h2 id="what-this-post-covers">What this post covers</h2>

<p>This post builds directly on the <a href="/2026/03/01/debug-probe-mcp-server.html">debug probe MCP server</a>. If you haven’t read that one, the short version: the agent can flash firmware, halt the CPU, set breakpoints, read registers and memory — all through a J-Link debug probe over SWD/JTAG.</p>

<p>Here, the agent uses that foundation to deploy and iterate on an edge AI model. Along the way, it builds two custom plugins that turn the debug probe into an edge-AI development environment.</p>

<p>The embedded <a href="/2026/03/05/claude-replay.html">session replays</a> show the actual agent sessions — edited for length, but with real tool calls and responses.</p>

<p>This is written for ML engineers who want to test models on real hardware — and for embedded engineers looking to accelerate their development workflow with agents.</p>

<hr />

<h2 id="the-setup">The setup</h2>

<p>The model is <a href="https://github.com/tensorflow/tflite-micro/tree/main/tensorflow/lite/micro/examples/micro_speech">micro_speech</a> — a TFLite Micro keyword spotting model from the TensorFlow examples. 18.8KB, int8 quantized, four classes: <em>yes</em>, <em>no</em>, <em>silence</em>, <em>unknown</em>. Designed specifically for microcontrollers.</p>

<p>The target is a <a href="https://www.nordicsemi.com/Products/Development-hardware/nRF52840-DK">Nordic nRF52840 development kit</a> — ARM Cortex-M4F at 64 MHz, 1MB flash, 256KB RAM, running Zephyr RTOS. A common board, well-supported by Zephyr and CMSIS.</p>

<p>The agent is <a href="https://docs.anthropic.com/en/docs/claude-code">Claude Code</a> with the <a href="/2026/03/01/debug-probe-mcp-server.html">debug probe MCP server</a> installed — though <a href="/2026/03/04/mcp-any-agent.html">any MCP-capable agent</a> would work.</p>

<p>The starting point is Nordic’s <a href="https://github.com/nrfconnect/sdk-nrf/tree/main/samples/bluetooth/peripheral_uart">Peripheral UART</a> sample — a clean Zephyr project that exposes a UART interface over both serial and BLE. TFLite Micro was added on top of this existing firmware.</p>

<p>End-to-end inference looks like this: one second of audio goes in, preprocessing extracts MFCC features (49 frames × 40 coefficients, the spectral fingerprint of the audio), those features feed the neural network, and the network outputs confidence scores for each class.</p>

<div class="mermaid">
%%{init: {'theme': 'dark', 'themeVariables': {'edgeLabelBackground': 'transparent'}}}%%
graph LR
    A["🎤 Audio<br />1s @ 16kHz"] --&gt; B["📊 Preprocessing<br />49 × 40 MFCC"]
    B --&gt; C["🧠 TFLite Micro<br />18.8KB int8"]
    C --&gt; D["📋 Output<br />yes / no /<br />silence / unknown"]
    style A fill:#1a365d,stroke:#63b3ed,stroke-width:2px,color:#fff
    style B fill:#4a1942,stroke:#f687b3,stroke-width:2px,color:#fff
    style C fill:#2d1b69,stroke:#b794f4,stroke-width:2px,color:#fff
    style D fill:#1a365d,stroke:#63b3ed,stroke-width:2px,color:#fff
</div>

<p>For simplicity, there is no microphone or PDM/I2S input in this setup. Audio is injected through the debug probe — the agent writes raw PCM data directly into the device’s memory and triggers the on-device preprocessing and inference pipeline.</p>

<hr />

<h2 id="the-session">The session</h2>

<p>The entire deployment happened in a single Claude Code session, roughly 90 minutes. No code written by hand, no hardware physically touched, never left the terminal. A few steering interventions made the difference — step back, simplify, and redirect when the agent was overcomplicating things. No predefined instructions were used — no <code class="language-plaintext highlighter-rouge">CLAUDE.md</code>, no custom skills. With them, the agent can skip the discovery phase and go straight to building.</p>

<p><img src="/assets/images/posts/edge-ai-mcp/timeline.png" alt="Session timeline" class="align-center" /></p>

<h3 id="1-initial-setup--debugging-24-min">1. Initial setup &amp; debugging (~24 min)</h3>

<p>The agent set up the project, built and flashed firmware, hit a hard fault, and worked around it by disabling optimized kernels. First inference: 865ms — slow but correct. It then built a custom debug probe plugin — the <em>TFLite Micro inspector</em> — to interact with the model at a higher level — inspect tensors, inject audio, read predictions — instead of raw memory addresses.</p>

<div class="embed-responsive">
<iframe src="/assets/demos/edge-ai-mcp/Edge_AI_Demo_-_Initial_Setup.html" width="100%" height="420" frameborder="0"></iframe>
</div>

<h3 id="2-performance-optimization-7-min">2. Performance optimization (~7 min)</h3>

<p>With the plugin in place, the agent went back and fixed the root cause. CMSIS-NN — ARM’s optimized neural network kernels, the embedded equivalent of cuDNN — uses SIMD instructions that require aligned memory access. The model data array had no alignment constraint, so the linker placed it at an arbitrary address and CMSIS-NN’s <code class="language-plaintext highlighter-rouge">LDRD</code> instructions faulted. One-line fix: <code class="language-plaintext highlighter-rouge">alignas(16)</code> on the model array. Inference dropped from 865ms (reference kernels) to <strong>31ms</strong> with CMSIS-NN — a <strong>28x speedup</strong>.</p>

<div class="embed-responsive">
<iframe src="/assets/demos/edge-ai-mcp/Edge_AI_Demo_-_Performance_Optimization_.html" width="100%" height="420" frameborder="0"></iframe>
</div>

<h3 id="3-preprocessing-implementation-47-min">3. Preprocessing implementation (~47 min)</h3>

<p>The model expects MFCC features — a spectral fingerprint of the audio — not raw waveforms. To test with real recordings, those features need to be extracted somewhere: either on the host in Python, or on the device in firmware. The agent started with Python (librosa), which is faster to iterate on. It ran, but classifications were wrong — training/serving skew. The model was trained with a specific fixed-point preprocessing pipeline that includes spectral subtraction and per-channel automatic gain control — steps that don’t exist in standard MFCC extraction. The features looked right but were semantically wrong.</p>

<p>Pivoted to implementing the exact training pipeline in firmware. Correct classifications, but preprocessing took 5.3 seconds. Switching the compiler to optimize for speed cut it to 2.6 seconds. Per-step profiling revealed the FFT was 98% of the remaining time — replacing Kiss FFT with ARM’s CMSIS-DSP <code class="language-plaintext highlighter-rouge">arm_rfft_q15</code> brought preprocessing to <strong>67ms</strong>.</p>

<table>
  <thead>
    <tr>
      <th>Change</th>
      <th>Preprocessing</th>
      <th>Flash</th>
    </tr>
  </thead>
  <tbody>
    <tr>
      <td>Initial (Kiss FFT, optimize for size)</td>
      <td>5,348 ms</td>
      <td>342 KB</td>
    </tr>
    <tr>
      <td>Optimize for speed</td>
      <td>2,616 ms</td>
      <td>372 KB</td>
    </tr>
    <tr>
      <td>ARM-optimized FFT</td>
      <td><strong>67 ms</strong></td>
      <td>442 KB</td>
    </tr>
  </tbody>
</table>

<p>The agent then tried to optimize the remaining preprocessing steps with CMSIS-DSP intrinsics — each attempt either broke accuracy or ran slower, so all were reverted. The compiler’s <code class="language-plaintext highlighter-rouge">-O2</code> was already doing a good job on those small loops. The tradeoff: flash grows from 342KB to 442KB. On a chip with 1MB of flash, that’s fine — but on a tighter budget you’d weigh that differently.</p>

<div class="embed-responsive">
<iframe src="/assets/demos/edge-ai-mcp/Edge_AI_Demo_-_Preprocessing_Implementation.html" width="100%" height="420" frameborder="0"></iframe>
</div>

<h3 id="4-final-profiling--verification-15-min">4. Final profiling &amp; verification (~15 min)</h3>

<p>Using the plugin’s <code class="language-plaintext highlighter-rouge">arena_info</code> tool, the agent found only 6,948 bytes used out of 16,384 allocated — and right-sized the tensor arena to 7KB, saving 9KB of RAM. The agent initially instrumented the firmware with timestamps for profiling. I steered it toward using the Cortex-M4’s DWT cycle counter instead — <strong>hardware profiling with zero firmware changes</strong>. That led to a second plugin — the <em>Cortex-M profiler</em> — non-invasive cycle counting through the debug probe. Final validation — automated through the plugin’s <code class="language-plaintext highlighter-rouge">accuracy_test</code> tool — against 130 real-world recordings from the Google Speech Commands dataset: <strong>94.6% accuracy</strong>.</p>

<div class="embed-responsive">
<iframe src="/assets/demos/edge-ai-mcp/Edge_AI_Demo_-_Profiling___Verification.html" width="100%" height="420" frameborder="0"></iframe>
</div>

<p><strong>Final numbers:</strong></p>

<table>
  <thead>
    <tr>
      <th>Metric</th>
      <th>Value</th>
    </tr>
  </thead>
  <tbody>
    <tr>
      <td>Preprocessing</td>
      <td>67 ms</td>
    </tr>
    <tr>
      <td>Inference</td>
      <td>31 ms</td>
    </tr>
    <tr>
      <td><strong>Total end-to-end</strong></td>
      <td><strong>98 ms</strong></td>
    </tr>
    <tr>
      <td>Flash</td>
      <td>442 KB (42% of 1 MB)</td>
    </tr>
    <tr>
      <td>RAM</td>
      <td>120 KB (46% of 256 KB)</td>
    </tr>
    <tr>
      <td>Tensor arena</td>
      <td>7 KB (97% utilized)</td>
    </tr>
  </tbody>
</table>

<p>The agent also documented the entire process as a <a href="https://github.com/es617/nrf52840-edge-ai/blob/main/EDGE_AI_SETUP.md">technical setup guide</a> — build instructions, troubleshooting, per-step profiling data, and optimization history — so a human engineer can reproduce or continue the work.</p>

<hr />

<h2 id="the-two-plugins">The two plugins</h2>

<p>Two Python files — the <em>TFLite Micro inspector</em> and the <em>Cortex-M profiler</em> — turned the debug probe from a byte-level tool into an edge-AI development environment.</p>

<p>These are the third stage of the <a href="/2026/02/10/ble-mcp-server.html">poke→spec→plugin arc</a> — but here, the agent built its own plugins during the session, then used them to accelerate everything that followed. The plugin creation itself took 6 minutes. The time saved by having structured tools instead of raw memory access was far greater.</p>

<div class="mermaid">
%%{init: {'theme': 'dark', 'themeVariables': {'edgeLabelBackground': 'transparent'}}}%%
graph LR
    A["🤖 Agent"] --&gt; S
    subgraph S["⚙️ Debug Probe MCP Server"]
        P1["🔌 tflite_micro<br />9 tools"]
        P2["🔌 cortex_m_profiler<br />3 tools"]
        B["🔧 built-in tools<br />flash, halt, r/w <br /> breakpoints"]
    end
    S --&gt; H["📡 nRF52840"]
    style A fill:#2d1b69,stroke:#b794f4,stroke-width:2px,color:#fff
    style P1 fill:#4a1942,stroke:#f687b3,stroke-width:2px,color:#fff
    style P2 fill:#4a1942,stroke:#f687b3,stroke-width:2px,color:#fff
    style S fill:#1a1a2e,stroke:#f687b3,stroke-width:2px,color:#fff
    style H fill:#1a365d,stroke:#63b3ed,stroke-width:2px,color:#fff
</div>

<p><strong>TFLite Micro inspector</strong> (9 tools) — model-level interaction. The agent reasons about the ML model, not memory addresses.</p>

<table>
  <thead>
    <tr>
      <th>Tool</th>
      <th>What it does</th>
    </tr>
  </thead>
  <tbody>
    <tr>
      <td><code class="language-plaintext highlighter-rouge">model_info</code></td>
      <td>Read model metadata from flash (size, FlatBuffer ID, schema version)</td>
    </tr>
    <tr>
      <td><code class="language-plaintext highlighter-rouge">arena_info</code></td>
      <td>Read tensor arena address, total/used size, utilization %</td>
    </tr>
    <tr>
      <td><code class="language-plaintext highlighter-rouge">tensor_info</code></td>
      <td>Read input/output buffer addresses, sizes, quantization params</td>
    </tr>
    <tr>
      <td><code class="language-plaintext highlighter-rouge">write_input</code></td>
      <td>Write features to input tensor (from <code class="language-plaintext highlighter-rouge">.bin</code> file, <code class="language-plaintext highlighter-rouge">.hex</code>, or test pattern)</td>
    </tr>
    <tr>
      <td><code class="language-plaintext highlighter-rouge">write_pcm</code></td>
      <td>Write a <code class="language-plaintext highlighter-rouge">.wav</code> file as raw PCM, run on-device preprocessing + inference</td>
    </tr>
    <tr>
      <td><code class="language-plaintext highlighter-rouge">infer</code></td>
      <td>Trigger inference on current input tensor contents</td>
    </tr>
    <tr>
      <td><code class="language-plaintext highlighter-rouge">read_output</code></td>
      <td>Read output scores (raw int8 + dequantized floats with class labels)</td>
    </tr>
    <tr>
      <td><code class="language-plaintext highlighter-rouge">read_input</code></td>
      <td>Read input tensor summary (min/max/mean/non-zero count)</td>
    </tr>
    <tr>
      <td><code class="language-plaintext highlighter-rouge">accuracy_test</code></td>
      <td>Batch accuracy test over a directory of labeled <code class="language-plaintext highlighter-rouge">.wav</code> files</td>
    </tr>
  </tbody>
</table>

<p>All addresses are resolved automatically via ELF symbol lookup inside the debug probe MCP server — the agent never deals with raw addresses, and the tools keep working across rebuilds. Output scores are dequantized for human-readable results:</p>

<div class="language-plaintext highlighter-rouge"><div class="highlight"><pre class="highlight"><code>predicted_class: "yes"
confidence: 99.6%
categories: silence=0.0%, unknown=0.0%, yes=99.6%, no=7.0%
</code></pre></div></div>

<p><strong>Cortex-M profiler</strong> (3 tools) — non-invasive hardware cycle counting, zero firmware changes.</p>

<table>
  <thead>
    <tr>
      <th>Tool</th>
      <th>What it does</th>
    </tr>
  </thead>
  <tbody>
    <tr>
      <td><code class="language-plaintext highlighter-rouge">dwt_setup</code></td>
      <td>Enable DWT cycle counter (set TRCENA in DEMCR, CYCCNTENA in DWT_CTRL)</td>
    </tr>
    <tr>
      <td><code class="language-plaintext highlighter-rouge">dwt_read</code></td>
      <td>Read current CYCCNT value, optionally reset</td>
    </tr>
    <tr>
      <td><code class="language-plaintext highlighter-rouge">measure</code></td>
      <td>Measure CPU cycles between two breakpoint addresses</td>
    </tr>
  </tbody>
</table>

<p>Both plugins work with any TFLite Micro model on any Cortex-M target — class labels, model symbols, and CPU frequency are configurable. Available in the <a href="https://github.com/es617/dbgprobe-mcp-server">dbgprobe-mcp-server</a> and <a href="https://github.com/es617/nrf52840-edge-ai">nrf52840-edge-ai</a> repositories.</p>

<hr />

<h2 id="what-this-means-for-ml-engineers">What this means for ML engineers</h2>

<p>If you’ve trained a model and want to test it on real hardware — not ship it to production, but <em>try it</em> and <em>learn the embedded side along the way</em> — this workflow gets you there in hours instead of weeks.</p>

<p>You don’t need to learn Zephyr or CMake. You don’t need to understand linker scripts or debug hard faults manually. You don’t need to write fixed-point DSP code by hand or instrument firmware for profiling. The agent handles the embedded plumbing. You focus on what you know: is the model working? Are the classifications correct? Is the latency acceptable?</p>

<p>Think of it as running a model in a Jupyter notebook before building the serving infrastructure — except the notebook is running on real silicon. The tensor arena is like a pre-allocated memory pool for intermediate activations (similar to how TensorFlow manages GPU memory, but with a fixed budget set at compile time). CMSIS-NN is the embedded equivalent of cuDNN — optimized kernels for common neural network layers.</p>

<p>This is not production deployment. The firmware the agent writes needs review. The memory layout needs hardening. Power management is nonexistent. But as a prototyping and validation tool — getting to “yes, this model runs on this chip, here are the real numbers on real silicon” — it collapses the timeline dramatically.</p>

<p>Getting from zero to 70% fast lets you spend your expert attention on the hard 30% — power optimization, edge cases, production robustness, certification. The piping, the configuration, the build-flash-test iteration — that’s what the agent accelerates.</p>

<hr />

<h2 id="closing-thought">Closing thought</h2>

<p>The earlier posts in this series gave the agent access to hardware surfaces — <a href="/2026/02/10/ble-mcp-server.html">BLE</a>, <a href="/2026/02/15/serial-mcp-server.html">serial</a>, <a href="/2026/03/01/debug-probe-mcp-server.html">debug probes</a>. This post is different. It isn’t about building a new MCP server. It’s about what happens when you combine an existing tool — the debug probe MCP server — with domain-specific plugins and point them at a real problem.</p>

<p>The session took 90 minutes. Doing the same work manually — Zephyr setup, TFLite Micro integration, CMSIS-NN debugging, fixed-point FFT conversion, profiling — typically takes days. Not because it’s conceptually hard, but because every step involves build systems, toolchain quirks, and hardware debugging. The agent handles the plumbing. The engineer directs the intent.</p>

<p>The interesting shift isn’t “AI that writes firmware.” It’s AI that iterates on the physical behavior of a real system — flashing, observing, measuring, adjusting — in a tight loop. Edge AI deployment is one example. The pattern applies anywhere the gap between software intent and physical behavior needs to close.</p>

<hr />

<h3 id="links">Links</h3>

<ul>
  <li>dbgprobe-mcp-server: <a href="https://github.com/es617/dbgprobe-mcp-server">GitHub</a> · <a href="https://pypi.org/project/dbgprobe-mcp-server/">PyPI</a></li>
  <li>tflite_micro plugin: <a href="https://github.com/es617/dbgprobe-mcp-server/tree/main/examples/plugins">README</a></li>
  <li>cortex_m_profiler plugin: <a href="https://github.com/es617/dbgprobe-mcp-server/tree/main/examples/plugins">README</a></li>
  <li>TFLite Micro: <a href="https://github.com/tensorflow/tflite-micro">GitHub</a></li>
  <li>claude-replay: <a href="https://github.com/es617/claude-replay">GitHub</a> · <a href="https://www.npmjs.com/package/claude-replay">npm</a></li>
</ul>]]></content><author><name>Enrico Santagati</name></author><category term="mcp" /><category term="debug" /><category term="tflite" /><category term="edge-ai" /><category term="tinyml" /><category term="ml" /><category term="nrf52840" /><category term="microcontroller" /><category term="zephyr" /><category term="cmsis-nn" /><category term="python" /><category term="agents" /><category term="tooling" /><category term="hardware" /><category term="embedded" /><summary type="html"><![CDATA[Deploying a TFLite Micro keyword spotting model on an nRF52840 from a single terminal session — no code written by hand, no hardware touched.]]></summary></entry><entry><title type="html">Turning Claude Code Sessions into HTML Replays</title><link href="https://es617.dev/2026/03/05/claude-replay.html" rel="alternate" type="text/html" title="Turning Claude Code Sessions into HTML Replays" /><published>2026-03-05T00:00:00+00:00</published><updated>2026-03-05T00:00:00+00:00</updated><id>https://es617.dev/2026/03/05/claude-replay</id><content type="html" xml:base="https://es617.dev/2026/03/05/claude-replay.html"><![CDATA[<hr />

<p>Claude Code sessions are great for development, but hard to share.</p>

<p>Screen recordings are bulky, static, and you can’t search or skip ahead. Copy-pasting raw transcripts is noisy — tool calls, thinking blocks, and responses all run together. The most interesting part of a session isn’t just the final output — it’s the <em>reasoning</em>: which tools the agent called, in what order, and why.</p>

<p>I’ve been writing a <a href="/let-the-ai-out/">series of posts</a> about giving AI agents direct access to hardware through MCP, and every article includes demos of the agent interacting with real devices. I wanted to show the full sessions — not just cherry-picked screenshots — but there wasn’t a good way to do that.</p>

<h2 id="the-logs-are-already-there">The logs are already there</h2>

<p>Claude Code stores complete session transcripts as JSONL files in <code class="language-plaintext highlighter-rouge">~/.claude/projects/</code>. These logs already contain everything needed to reconstruct a session:</p>

<ul>
  <li>User prompts</li>
  <li>Assistant responses (with markdown formatting)</li>
  <li>Tool calls and their results</li>
  <li>Thinking blocks</li>
  <li>Timestamps for every interaction</li>
</ul>

<p>The data is all there. It just needs a player.</p>

<h2 id="so-i-built-one">So I built one</h2>

<p><a href="https://github.com/es617/claude-replay"><strong>claude-replay</strong></a> is a small CLI tool that converts these logs into interactive HTML replays. It works with sessions from Claude Code — both the terminal CLI and the VS Code extension — and also supports Cursor transcripts.</p>

<div class="language-bash highlighter-rouge"><div class="highlight"><pre class="highlight"><code>npx claude-replay session.jsonl <span class="nt">-o</span> replay.html
</code></pre></div></div>

<p>The output is a single self-contained HTML file — no external dependencies, no framework, no server. You can email it, host it on GitHub Pages, or embed it in a blog post, or link to it. For platforms that don’t support iframes (like dev.to or Medium), you can host the replay and embed it via CodePen.</p>

<p>Here’s what that looks like:</p>

<div style="max-width: 600px; margin: 0 auto 1.5em;">
<iframe src="/assets/demos/peripheral-uart-demo.html" width="100%" height="500" frameborder="0"></iframe>
</div>

<p>Hit play, step through with arrow keys, or click the progress bar to jump around. Expand tool calls to see inputs and results. Collapse thinking blocks if you want to focus only on the conversation.</p>

<h2 id="use-cases">Use cases</h2>

<p>The obvious one is <strong>blog posts and documentation</strong> — embed a session instead of stitching together screenshots. But the use case I didn’t expect was <strong>knowledge sharing in teams</strong>.</p>

<p>When you’re working with AI agents, the interesting artifact isn’t just the code that got written — it’s the session that produced it. How did the agent approach the problem? What tools did it reach for? Where did it struggle? A replay captures all of that in a format someone else can actually step through.</p>

<p>Instead of “hey, look at this cool thing the agent did” in Slack followed by a wall of text, you send a replay.</p>

<h2 id="features">Features</h2>

<ul>
  <li>Interactive playback with speed control (0.5x to 5x)</li>
  <li>Collapse/expand tool calls and thinking blocks</li>
  <li>Bookmarks and chapters for long sessions</li>
  <li>Keyboard shortcuts (space, arrow keys)</li>
  <li>Multiple themes (dracula, monokai, github-light, and more)</li>
  <li>Automatic secret redaction</li>
  <li>Self-contained — zero external dependencies</li>
</ul>

<h2 id="getting-started">Getting started</h2>

<div class="language-bash highlighter-rouge"><div class="highlight"><pre class="highlight"><code><span class="c"># Install globally</span>
npm <span class="nb">install</span> <span class="nt">-g</span> claude-replay

<span class="c"># Or run directly with npx</span>
npx claude-replay session.jsonl <span class="nt">-o</span> replay.html

<span class="c"># Find your session logs</span>
<span class="nb">ls</span> ~/.claude/projects/<span class="k">*</span>/
</code></pre></div></div>

<p>A few useful options:</p>

<div class="language-bash highlighter-rouge"><div class="highlight"><pre class="highlight"><code><span class="c"># Only include turns 5-15, start at 2x speed</span>
claude-replay session.jsonl <span class="nt">--turns</span> 5-15 <span class="nt">--speed</span> 2.0 <span class="nt">-o</span> replay.html

<span class="c"># Add chapter markers</span>
claude-replay session.jsonl <span class="nt">--mark</span> <span class="s2">"3:Flash firmware"</span> <span class="nt">--mark</span> <span class="s2">"7:BLE scan"</span> <span class="nt">-o</span> replay.html

<span class="c"># Use a different theme</span>
claude-replay session.jsonl <span class="nt">--theme</span> dracula <span class="nt">-o</span> replay.html
</code></pre></div></div>

<hr />

<h3 id="links">Links</h3>

<ul>
  <li>claude-replay (source): <a href="https://github.com/es617/claude-replay">GitHub</a></li>
  <li>claude-replay (package): <a href="https://www.npmjs.com/package/claude-replay">npm</a></li>
</ul>]]></content><author><name>Enrico Santagati</name></author><category term="claude-code" /><category term="tooling" /><category term="agents" /><category term="developer-tools" /><category term="javascript" /><summary type="html"><![CDATA[A CLI tool that converts Claude Code session logs into interactive, self-contained HTML replays you can share, embed, or host anywhere.]]></summary></entry><entry><title type="html">Let the AI Out: Same Hardware Tools, Every AI Agent</title><link href="https://es617.dev/2026/03/04/mcp-any-agent.html" rel="alternate" type="text/html" title="Let the AI Out: Same Hardware Tools, Every AI Agent" /><published>2026-03-04T00:00:00+00:00</published><updated>2026-03-04T00:00:00+00:00</updated><id>https://es617.dev/2026/03/04/mcp-any-agent</id><content type="html" xml:base="https://es617.dev/2026/03/04/mcp-any-agent.html"><![CDATA[<hr />
<blockquote>
  <p><em>This post is part of the <a href="/let-the-ai-out/">Let the AI Out</a> series on giving AI agents direct access to hardware. <a href="/let-the-ai-out/">Start here</a> for the overview.</em></p>
</blockquote>

<p>The previous posts in this series focused on <em>what</em> the agent can access — <a href="/2026/02/10/ble-mcp-server.html">BLE</a>, <a href="/2026/02/15/serial-mcp-server.html">serial</a>, <a href="/2026/03/01/debug-probe-mcp-server.html">debug probes</a>. Each one gave the agent a new hardware interface.</p>

<p>This post is about <em>where</em> the agent runs — and why that <em>shouldn’t</em> matter.</p>

<p>The agent doesn’t <em>need</em> MCP to talk to hardware. It could generate a pyserial script, shell out to GDB, or write bleak code directly.</p>

<p>But every model reasons about that differently, and every client executes scripts in its own way. The integration ends up being reimplemented over and over.</p>

<p>For hardware, this is especially painful. Tools like <code class="language-plaintext highlighter-rouge">pyocd</code>, <code class="language-plaintext highlighter-rouge">probe-rs</code>, or SEGGER’s J-Link CLI aren’t well represented in training data. The agent is more likely to hallucinate flags or generate outdated code. And hardware interfaces are inherently stateful — you can’t open a BLE connection, read a characteristic, and subscribe to notifications across three separate script invocations. The session has to stay alive.</p>

<p>MCP changes that. The hardware knowledge lives in one place - the server — with stateful sessions, standard discovery, structured parameters, and typed responses. The client just calls tools. That’s what makes interop possible.</p>

<p>Instead of embedding hardware knowledge inside the agent or the IDE, MCP moves it into reusable servers. The agents can change, but the hardware interface stays the same.</p>

<p><img src="/assets/images/posts/mcp-any-agent/multi_agent.png" alt="Multiple agents, one protocol" class="align-center" /></p>

<p>This post tests that claim. The same three MCP servers — <a href="/2026/02/10/ble-mcp-server.html">BLE</a>, <a href="/2026/02/15/serial-mcp-server.html">Serial</a>, <a href="/2026/03/01/debug-probe-mcp-server.html">Debug Probe</a> — running across Claude Code, VS Code + Copilot, and Cursor. Same servers, same tools, different hosts.</p>

<hr />

<h2 id="the-setup">The setup</h2>

<p>All three MCP servers — BLE, Serial, and Debug Probe — configured in three different clients, talking to real hardware.</p>

<div class="mermaid">
%%{init: {'theme': 'dark', 'themeVariables': {'edgeLabelBackground': 'transparent'}}}%%
graph TD
    CC["🖥️ Claude Code"] --- BLE["⚙️ BLE<br />MCP Server"]
    CC --- SER["⚙️ Serial<br />MCP Server"]
    CC --- DBG["⚙️ Debug Probe<br />MCP Server"]
    VS["🖥️ VSC<br />Copilot"] --- BLE
    VS --- SER
    VS --- DBG
    CU["🖥️ Cursor"] --- BLE
    CU --- SER
    CU --- DBG
    BLE --&gt;|BLE| D["📡 Device"]
    SER --&gt;|UART| D
    DBG --&gt;|SWD| D
    style CC fill:#2d1b69,stroke:#b794f4,stroke-width:2px,color:#fff
    style VS fill:#2d1b69,stroke:#b794f4,stroke-width:2px,color:#fff
    style CU fill:#2d1b69,stroke:#b794f4,stroke-width:2px,color:#fff
    style BLE fill:#4a1942,stroke:#f687b3,stroke-width:2px,color:#fff
    style SER fill:#4a1942,stroke:#f687b3,stroke-width:2px,color:#fff
    style DBG fill:#4a1942,stroke:#f687b3,stroke-width:2px,color:#fff
    style D fill:#1a365d,stroke:#63b3ed,stroke-width:2px,color:#fff
</div>

<h2 id="claude-code">Claude Code</h2>

<p>Terminal-native. MCP servers are registered from the CLI:</p>

<div class="language-bash highlighter-rouge"><div class="highlight"><pre class="highlight"><code>claude mcp add ble <span class="nt">-e</span> <span class="nv">BLE_MCP_ALLOW_WRITES</span><span class="o">=</span><span class="nb">true</span> <span class="nt">-e</span> <span class="nv">BLE_MCP_PLUGINS</span><span class="o">=</span>all <span class="nt">--</span> ble_mcp
claude mcp add serial <span class="nt">-e</span> <span class="nv">SERIAL_MCP_PLUGINS</span><span class="o">=</span>all <span class="nt">--</span> serial_mcp
claude mcp add dbgprobe <span class="nt">-e</span> <span class="nv">DBGPROBE_JLINK_DEVICE</span><span class="o">=</span>nRF52840_xxAA <span class="nt">--</span> dbgprobe_mcp
</code></pre></div></div>

<p>Tools are discovered automatically. Everything — tool calls, results, reasoning — flows through the same terminal session. For permissions, <code class="language-plaintext highlighter-rouge">/permissions</code> supports wildcards: <code class="language-plaintext highlighter-rouge">mcp__ble__*</code> allows all BLE tools, <code class="language-plaintext highlighter-rouge">mcp__dbgprobe__*</code> allows all debug probe tools.</p>

<h2 id="vs-code--copilot">VS Code + Copilot</h2>

<p>IDE-native. MCP servers are configured via <code class="language-plaintext highlighter-rouge">.vscode/mcp.json</code>:</p>

<div class="language-json highlighter-rouge"><div class="highlight"><pre class="highlight"><code><span class="p">{</span><span class="w">
  </span><span class="nl">"servers"</span><span class="p">:</span><span class="w"> </span><span class="p">{</span><span class="w">
    </span><span class="nl">"ble"</span><span class="p">:</span><span class="w"> </span><span class="p">{</span><span class="w">
      </span><span class="nl">"type"</span><span class="p">:</span><span class="w"> </span><span class="s2">"stdio"</span><span class="p">,</span><span class="w">
      </span><span class="nl">"command"</span><span class="p">:</span><span class="w"> </span><span class="s2">"ble_mcp"</span><span class="p">,</span><span class="w">
      </span><span class="nl">"env"</span><span class="p">:</span><span class="w"> </span><span class="p">{</span><span class="w">
        </span><span class="nl">"BLE_MCP_ALLOW_WRITES"</span><span class="p">:</span><span class="w"> </span><span class="s2">"true"</span><span class="p">,</span><span class="w">
        </span><span class="nl">"BLE_MCP_PLUGINS"</span><span class="p">:</span><span class="w"> </span><span class="s2">"all"</span><span class="w">
      </span><span class="p">}</span><span class="w">
    </span><span class="p">}</span><span class="w">
  </span><span class="p">}</span><span class="w">
</span><span class="p">}</span><span class="w">
</span></code></pre></div></div>
<p>Serial and debug probe servers are configured the same way.</p>

<p>VS Code provides a “Start” button inline in the JSON file. Servers also start automatically when you open Copilot Chat. Tool calls appear in the chat panel with approval prompts — you can allow a specific tool or all tools for a server, scoped to the current session, workspace, or everywhere.</p>

<h2 id="cursor">Cursor</h2>

<p>Also IDE-native, but with some differences. Configuration lives in <code class="language-plaintext highlighter-rouge">.cursor/mcp.json</code>:</p>

<div class="language-json highlighter-rouge"><div class="highlight"><pre class="highlight"><code><span class="p">{</span><span class="w">
  </span><span class="nl">"mcpServers"</span><span class="p">:</span><span class="w"> </span><span class="p">{</span><span class="w">
    </span><span class="nl">"ble"</span><span class="p">:</span><span class="w"> </span><span class="p">{</span><span class="w">
      </span><span class="nl">"command"</span><span class="p">:</span><span class="w"> </span><span class="s2">"ble_mcp"</span><span class="p">,</span><span class="w">
      </span><span class="nl">"args"</span><span class="p">:</span><span class="w"> </span><span class="p">[],</span><span class="w">
      </span><span class="nl">"env"</span><span class="p">:</span><span class="w"> </span><span class="p">{</span><span class="w">
        </span><span class="nl">"BLE_MCP_ALLOW_WRITES"</span><span class="p">:</span><span class="w"> </span><span class="s2">"true"</span><span class="p">,</span><span class="w">
        </span><span class="nl">"BLE_MCP_TOOL_SEPARATOR"</span><span class="p">:</span><span class="w"> </span><span class="s2">"_"</span><span class="w">
      </span><span class="p">}</span><span class="w">
    </span><span class="p">}</span><span class="w">
  </span><span class="p">}</span><span class="w">
</span><span class="p">}</span><span class="w">
</span></code></pre></div></div>
<p>Serial and debug probe servers follow the same pattern.</p>

<p>Servers are managed in <strong>Settings &gt; Tools &amp; MCP</strong>, where each one shows a status indicator and a list of discovered tools. Tools are disabled by default — you need to enable them manually. For permissions, Cursor offers three modes: “Ask every time,” “Use allowlist” (approve once per tool), and “Run everything.”</p>

<p>Note the <code class="language-plaintext highlighter-rouge">TOOL_SEPARATOR</code> env vars. The MCP spec allows dots in tool names (<code class="language-plaintext highlighter-rouge">ble.scan_start</code>, <code class="language-plaintext highlighter-rouge">serial.open</code>). Claude Code and VS Code + Copilot handle this fine, but Cursor converts dots to underscores and sends the mangled name — which the server doesn’t recognize. The fix: a configurable separator. Set <code class="language-plaintext highlighter-rouge">TOOL_SEPARATOR=_</code> and the server registers <code class="language-plaintext highlighter-rouge">ble_scan_start</code> instead. This required new releases across all three servers (ble-mcp-server 0.1.4, serial-mcp-server 0.1.2, dbgprobe-mcp-server 0.1.1).</p>

<p>A small thing — but exactly the kind of interop edge case that shows up when you test a protocol across real clients.</p>

<hr />

<h2 id="the-experiment">The experiment</h2>

<p>To test whether the same MCP servers behave consistently across different agent clients, I ran the same workflow against a Nordic nRF52840 development kit running Zephyr’s <a href="https://docs.nordicsemi.com/bundle/ncs-latest/page/nrf/samples/bluetooth/peripheral_uart/README.html">Peripheral UART</a> sample.</p>

<p>It exposes a UART interface over both serial and BLE (via Nordic’s UART Service, NUS) — so you can send a message over BLE and see it arrive on the serial console, and vice versa.</p>

<p>This makes it a convenient test device: it lets the agent exercise three independent hardware interfaces — silicon, serial console, and wireless — and verify that data flows correctly between them.</p>

<p>Each step below shows the same operation in Claude Code, VS Code + Copilot, and Cursor.</p>

<h3 id="programming-the-silicon">Programming the silicon</h3>

<p>The agent starts by interacting with the debug probe.</p>

<p>It discovers the connected J-Link, performs a full chip erase, and flashes the Zephyr firmware.</p>

<div class="gallery-3">
  <div class="gallery__item"><a href="/assets/images/posts/mcp-any-agent/claude_code_flash.png"><img src="/assets/images/posts/mcp-any-agent/claude_code_flash.png" alt="Claude Code — flashing firmware" /></a></div>
  <div class="gallery__item"><a href="/assets/images/posts/mcp-any-agent/vscode_flash.png"><img src="/assets/images/posts/mcp-any-agent/vscode_flash.png" alt="VS Code + Copilot — flashing firmware" /></a></div>
  <div class="gallery__item"><a href="/assets/images/posts/mcp-any-agent/cursor_flash.png"><img src="/assets/images/posts/mcp-any-agent/cursor_flash.png" alt="Cursor — flashing firmware" /></a></div>
</div>
<p style="text-align: center; font-size: 0.8em; color: #888;">Left: Claude Code · Center: VS Code + Copilot · Right: Cursor</p>

<p>This is the lowest layer of the system: direct access to the microcontroller itself.</p>

<h3 id="accessing-the-device-console">Accessing the device console</h3>

<p>Next the agent opens the serial console.</p>

<div class="gallery-3">
  <div class="gallery__item"><a href="/assets/images/posts/mcp-any-agent/claude_code_serial.png"><img src="/assets/images/posts/mcp-any-agent/claude_code_serial.png" alt="Claude Code — opening serial console" /></a></div>
  <div class="gallery__item"><a href="/assets/images/posts/mcp-any-agent/vscode_serial.png"><img src="/assets/images/posts/mcp-any-agent/vscode_serial.png" alt="VS Code + Copilot — opening serial console" /></a></div>
  <div class="gallery__item"><a href="/assets/images/posts/mcp-any-agent/cursor_serial.png"><img src="/assets/images/posts/mcp-any-agent/cursor_serial.png" alt="Cursor — opening serial console" /></a></div>
</div>
<p>At this point the agent has access to the device’s wired interface — the same console a developer would often use for debugging.</p>

<h3 id="discovering-the-wireless-interface">Discovering the wireless interface</h3>

<p>The firmware also exposes the same UART service over BLE.</p>

<p>The agent scans for nearby devices and connects to the Nordic UART device.</p>

<div class="gallery-3">
  <div class="gallery__item"><a href="/assets/images/posts/mcp-any-agent/claude_code_ble.png"><img src="/assets/images/posts/mcp-any-agent/claude_code_ble.png" alt="Claude Code — connecting over BLE" /></a></div>
  <div class="gallery__item"><a href="/assets/images/posts/mcp-any-agent/vscode_ble.png"><img src="/assets/images/posts/mcp-any-agent/vscode_ble.png" alt="VS Code + Copilot — connecting over BLE" /></a></div>
  <div class="gallery__item"><a href="/assets/images/posts/mcp-any-agent/cursor_ble.png"><img src="/assets/images/posts/mcp-any-agent/cursor_ble.png" alt="Cursor — connecting over BLE" /></a></div>
</div>

<p>This step demonstrates a completely different interaction surface: wireless discovery and GATT communication.</p>

<h3 id="end-to-end-validation">End-to-end validation</h3>

<p>Finally the agent verifies that the firmware is bridging the two interfaces correctly.</p>

<p>It sends a message over BLE and confirms it appears on the serial console, then performs the reverse test.</p>

<div class="gallery-3">
  <div class="gallery__item"><a href="/assets/images/posts/mcp-any-agent/claude_code_loop.png"><img src="/assets/images/posts/mcp-any-agent/claude_code_loop.png" alt="Claude Code — verifying UART-BLE bridge" /></a></div>
  <div class="gallery__item"><a href="/assets/images/posts/mcp-any-agent/vscode_loop.png"><img src="/assets/images/posts/mcp-any-agent/vscode_loop.png" alt="VS Code + Copilot — verifying UART-BLE bridge" /></a></div>
  <div class="gallery__item"><a href="/assets/images/posts/mcp-any-agent/cursor_loop.png"><img src="/assets/images/posts/mcp-any-agent/cursor_loop.png" alt="Cursor — verifying UART-BLE bridge" /></a></div>
</div>

<p>The agent is now interacting with the device through three independent surfaces:</p>
<div class="language-plaintext highlighter-rouge"><div class="highlight"><pre class="highlight"><code>Debug probe  → silicon control
Serial       → device console
BLE          → wireless interface
</code></pre></div></div>

<h3 id="what-the-transcripts-show">What the transcripts show</h3>

<p>The screenshots tell you the workflow is the same. The transcripts tell you the <em>reasoning</em> is different.</p>

<p>Each agent took a different path through the same set of tools. Claude Code was methodical — it found the hex file with a single search, performed full BLE service discovery before writing, and flushed the serial buffer proactively. VS Code + Copilot hedged — it ran two parallel BLE scans (one filtered, one broad) and struggled with its own file search before falling back to a directory listing. Cursor was the most direct — it picked <code class="language-plaintext highlighter-rouge">merged.hex</code> when <code class="language-plaintext highlighter-rouge">zephyr.hex</code> wasn’t in the expected location, used a name filter to narrow the scan, and moved through the steps with minimal narration.</p>

<p>Different strategies, different trade-offs, same MCP tool calls, same results. The protocol is the stable layer. How the agent plans and sequences is up to the model and the client. What the server exposes is always the same.</p>

<p>The only client-specific accommodation was the <a href="#cursor">tool separator fix</a> for Cursor. Everything else — the tool names, the parameters, the responses — was identical across all three.</p>

<p>Here’s the full Claude Code session — every tool call, every response:</p>

<div style="max-width: 600px; margin: 0 auto;">
<iframe src="/assets/demos/peripheral-uart-demo.html" width="100%" height="500" frameborder="0"></iframe>
<p style="text-align: center; font-size: 0.8em; color: #888;">Powered by <a href="https://www.npmjs.com/package/claude-replay">claude-replay</a></p>
</div>

<hr />

<h2 id="why-this-architecture-matters">Why this architecture matters</h2>

<p>MCP decouples the <em>capability</em> from the <em>client</em>.</p>

<p>The BLE server doesn’t know if it’s being called from a terminal, an IDE, or a script. It exposes tools — scan, connect, read, write — and the client decides how to present them. The same is true for serial and debug probe.</p>

<p>This is what a protocol buys you. The hardware integration is written once in the server, and every MCP-compatible client can use it. No plugins, no adapters, no client-specific code.</p>

<p>For hardware tools specifically, this matters more than it might seem. Embedded developers don’t all live in the same editor. Some work in VS Code, some in the terminal, some in specialized IDEs. The hardware interface shouldn’t depend on the editor choice.</p>

<p>Seen this way, MCP servers start to look less like plugins and more like infrastructure.</p>

<p>Each server exposes a surface of the physical system:</p>

<ul>
  <li>BLE exposes the wireless interface</li>
  <li>Serial exposes the debug console</li>
  <li>A debug probe exposes the silicon state</li>
</ul>

<p>These servers translate hardware interactions into structured tools an agent can reason about.</p>

<p><img src="/assets/images/posts/mcp-any-agent/mcp_arch.png" alt="MCP architecture" class="align-center" /></p>

<p>Once that interface exists, any MCP-compatible client can use it — a terminal agent, an IDE assistant, or something that hasn’t been built yet.</p>

<hr />

<h2 id="closing-thought">Closing thought</h2>

<p>The previous posts were about giving the agent eyes and hands — BLE for the wireless surface, serial for the debug console, and a debug probe for the silicon itself.</p>

<p>This post shows something different: those capabilities aren’t tied to a specific tool or editor. Because they’re exposed through MCP, they move with the agent. Terminal, IDE, or something else entirely — the same servers work the same way.</p>

<p>It’s also the first time all three ran together in a single workflow against the same device: debug probe, serial, and BLE. Flash the silicon, open the console, connect over the air, verify the bridge. Same tools, same hardware, different clients.</p>

<p>That’s the point of a protocol.</p>

<p>Write the server once. Any agent can use it.</p>

<hr />

<h3 id="links">Links</h3>

<ul>
  <li>ble-mcp-server: <a href="https://github.com/es617/ble-mcp-server">GitHub</a> · <a href="https://pypi.org/project/ble-mcp-server/">PyPI</a></li>
  <li>serial-mcp-server: <a href="https://github.com/es617/serial-mcp-server">GitHub</a> · <a href="https://pypi.org/project/serial-mcp-server/">PyPI</a></li>
  <li>dbgprobe-mcp-server: <a href="https://github.com/es617/dbgprobe-mcp-server">GitHub</a> · <a href="https://pypi.org/project/dbgprobe-mcp-server/">PyPI</a></li>
</ul>]]></content><author><name>Enrico Santagati</name></author><category term="mcp" /><category term="ble" /><category term="serial" /><category term="debug" /><category term="python" /><category term="agents" /><category term="tooling" /><category term="hardware" /><category term="embedded" /><category term="vscode" /><category term="cursor" /><summary type="html"><![CDATA[The same MCP servers — BLE, serial, debug probe — working across Claude Code, VS Code + Copilot, and Cursor. That's the point of a protocol.]]></summary></entry><entry><title type="html">Let the AI Out: Giving the AI Agent a Hardware Debug Probe</title><link href="https://es617.dev/2026/03/01/debug-probe-mcp-server.html" rel="alternate" type="text/html" title="Let the AI Out: Giving the AI Agent a Hardware Debug Probe" /><published>2026-03-01T00:00:00+00:00</published><updated>2026-03-01T00:00:00+00:00</updated><id>https://es617.dev/2026/03/01/debug-probe-mcp-server</id><content type="html" xml:base="https://es617.dev/2026/03/01/debug-probe-mcp-server.html"><![CDATA[<hr />
<blockquote>
  <p><em>This post is part of the <a href="/let-the-ai-out/">Let the AI Out</a> series on giving AI agents direct access to hardware. <a href="/let-the-ai-out/">Start here</a> for the overview.</em></p>
</blockquote>

<p><a href="/2026/02/15/serial-mcp-server.html">Serial MCP</a> gave the agent the developer’s view — boot banners, debug logs, CLI commands. <a href="/2026/02/10/ble-mcp-server.html">BLE MCP</a> gave it the user’s view — scanning, connecting, reading characteristics.</p>

<p>Both are curated surfaces. Both are views the firmware chooses to present.</p>

<p>A hardware debug probe bypasses all of that.</p>

<p>It connects directly to the silicon — the core, the memory, the registers. If the firmware lies, the probe tells the truth. If the firmware crashes, the probe still answers.</p>

<p><img src="/assets/images/posts/debug-probe-mcp-server/dbg_probe_ai.png" alt="AI agent at the debug probe" class="align-center" /></p>

<p>This post is about giving that level of access to an AI agent — the same access you have when you’re at your most powerful: halted at a breakpoint, staring at the stack.</p>

<p>When abstractions fail, you drop to the metal. Now the AI agent can too.</p>

<h2 id="what-this-looks-like-in-practice">What this looks like in practice</h2>

<!-- Courtesy of embedresponsively.com -->

<div class="responsive-video-container">
    <iframe src="https://www.youtube-nocookie.com/embed/nLt0Vj8TAHs" frameborder="0" webkitallowfullscreen="" mozallowfullscreen="" allowfullscreen=""></iframe>
  </div>

<p><em>End-to-end demo: connecting to a real target, flashing firmware, halting execution, setting breakpoints, reading memory, using ELF for symbol resolution, and attaching SVD for register-aware inspection.</em></p>

<blockquote>
  <p>The server currently supports <strong>J-Link probes only</strong>. The architecture is backend-agnostic — OpenOCD and pyOCD backends are planned — but today, you’ll need a J-Link and the SEGGER J-Link Software installed separately.</p>
</blockquote>

<hr />

<h2 id="what-this-is-and-what-to-read-first">What this is (and what to read first)</h2>

<p>This is the fifth post in the series:</p>

<ul>
  <li><a href="/2026/02/09/what-is-mcp.html"><strong>What Is MCP?</strong></a> — the protocol underneath. Start here if MCP is new to you.</li>
  <li><a href="/2026/02/10/ble-mcp-server.html"><strong>BLE MCP Server</strong></a> — wireless interface access. Covers the poke→spec→plugin arc in detail.</li>
  <li><a href="/2026/02/15/serial-mcp-server.html"><strong>Serial MCP Server</strong></a> — serial console access. Covers PTY mirroring and line-oriented I/O.</li>
  <li><a href="/2026/02/16/ble-serial-mcp-demo.html"><strong>BLE + Serial Demo</strong></a> — using both interfaces together to debug a real device.</li>
</ul>

<p>The Debug Probe MCP Server follows the same pattern: stateful MCP server, stdio transport, plugins, tracing. If you’ve read the earlier posts, the architecture should feel familiar.</p>

<div class="mermaid">
%%{init: {'theme': 'dark', 'themeVariables': {'edgeLabelBackground': 'transparent'}}}%%
graph TD
    A["🤖 Agent"] --&gt;|"MCP"| DBG["⚙️ Debug Probe<br />MCP Server"]
    A --&gt;|"MCP"| SER["⚙️ Serial<br />MCP Server"]
    A --&gt;|"MCP"| BLE["⚙️ BLE<br />MCP Server"]
    DBG --&gt;|"SWD/JTAG"| D["📡 Device"]
    SER --&gt;|"UART"| D
    BLE --&gt;|"BLE"| D
    style A fill:#2d1b69,stroke:#b794f4,stroke-width:2px,color:#fff
    style DBG fill:#4a1942,stroke:#f687b3,stroke-width:2px,color:#fff
    style SER fill:#4a1942,stroke:#f687b3,stroke-width:2px,color:#fff
    style BLE fill:#4a1942,stroke:#f687b3,stroke-width:2px,color:#fff
    style D fill:#1a365d,stroke:#63b3ed,stroke-width:2px,color:#fff
</div>

<hr />

<h2 id="a-quick-primer-on-debug-tools">A quick primer on debug tools</h2>

<p>If you’ve done embedded development, you know these tools well. If you haven’t, here’s the minimum context to follow the rest of the post.</p>

<p><img src="/assets/images/posts/debug-probe-mcp-server/debug_primer.png" alt="Debug tools primer" class="align-center" /></p>

<h3 id="the-debug-port">The debug port</h3>

<p>Most modern microcontrollers have a dedicated debug port built into the silicon — a hardware interface designed specifically for development. The two common ones are:</p>

<ul>
  <li><strong>SWD</strong> (Serial Wire Debug) — two wires (clock + data). Used by most ARM Cortex-M chips.</li>
  <li><strong>JTAG</strong> (Joint Test Action Group) — four or five wires. Older, more general.</li>
</ul>

<p>Both provide direct access to the CPU’s internal state — a hardware feature that works even if the firmware is broken, stuck, or not yet flashed.</p>

<h3 id="the-debug-probe">The debug probe</h3>

<p>The debug port on the chip speaks a low-level wire protocol. To use it from a computer, you need a <strong>debug probe</strong> — a small piece of hardware that bridges USB to SWD or JTAG.</p>

<p>Common ones:</p>

<ul>
  <li><strong>J-Link</strong> (SEGGER) — the workhorse. Fast, reliable, widely supported. What this MCP server uses today.</li>
  <li><strong>ST-Link</strong> — ships with every STM32 development board.</li>
  <li><strong>CMSIS-DAP</strong> — an open standard. Used by many low-cost probes.</li>
</ul>

<h3 id="the-debug-software-stack">The debug software stack</h3>

<p>The software that drives the probe is usually <strong>GDB</strong> (GNU Debugger) or a tool that speaks GDB’s protocol. The typical stack looks like this:</p>

<div class="mermaid">
%%{init: {'theme': 'dark', 'themeVariables': {'edgeLabelBackground': 'transparent'}}}%%
graph LR
    A["🖥️ GDB<br />(debugger)"] --&gt;|"GDB RSP<br />(TCP)"| B["⚙️ GDB Server<br />(J-Link, OpenOCD)"]
    B --&gt;|"SWD<br />JTAG"| C["🔌 Target<br />MCU"]
    style A fill:#2d1b69,stroke:#b794f4,stroke-width:2px,color:#fff
    style B fill:#4a1942,stroke:#f687b3,stroke-width:2px,color:#fff
    style C fill:#1a365d,stroke:#63b3ed,stroke-width:2px,color:#fff
</div>

<p>This MCP server replaces GDB in that stack — it talks directly to the GDB server, so the AI agent drives the debug protocol itself.</p>

<h3 id="what-you-can-do-with-it">What you can do with it</h3>

<p>Once connected — probe and software stack in place — you can:</p>

<ul>
  <li><strong>Control execution</strong> — halt, resume, single-step, breakpoints</li>
  <li><strong>Inspect and modify state</strong> — read/write memory, registers</li>
  <li><strong>Program and reset</strong> — flash firmware, soft/hard reset</li>
  <li><strong>High-speed logging</strong> — RTT (Real-Time Transfer) over the debug wire itself, no UART needed</li>
</ul>

<hr />

<h2 id="the-agents-development-flow">The agent’s development flow</h2>

<p>Here’s what a typical session looks like when the AI agent has access to a hardware debug probe — from connecting through flashing, halting, and setting breakpoints.</p>

<p><img src="/assets/images/posts/debug-probe-mcp-server/dev_flow.png" alt="Development flow" class="align-center" /></p>

<h3 id="connect-and-orient">Connect and orient</h3>

<p>The agent lists attached probes, picks one, and connects — specifying the target device, interface (SWD or JTAG), and clock speed. Behind the scenes, the server starts a JLinkGDBServer subprocess and opens a persistent GDB RSP connection over TCP. That connection stays open for the entire session — low-latency, stateful, ready for interactive debugging.</p>

<p align="center"><a href="/assets/images/posts/debug-probe-mcp-server/debug_probe_demo_list_connect.png"><img src="/assets/images/posts/debug-probe-mcp-server/debug_probe_demo_list_connect.png" alt="Listing probes and connecting" width="500" /></a></p>

<h3 id="flash-firmware">Flash firmware</h3>

<p>The agent can program the target directly — <code class="language-plaintext highlighter-rouge">.hex</code>, <code class="language-plaintext highlighter-rouge">.elf</code>, and <code class="language-plaintext highlighter-rouge">.bin</code> files are all supported. When you flash an ELF, the server automatically parses the symbol table (more on that below).</p>

<p>Flashing uses <code class="language-plaintext highlighter-rouge">JLinkExe</code> under the hood rather than going through GDB — it’s more reliable and handles vendor-specific unlock sequences. From the agent’s perspective, it’s a single tool call: flash and continue.</p>

<p align="center"><a href="/assets/images/posts/debug-probe-mcp-server/debug_probe_demo_erase_flash.png"><img src="/assets/images/posts/debug-probe-mcp-server/debug_probe_demo_erase_flash.png" alt="Erase and flash firmware" width="500" /></a></p>

<h3 id="halt-step-inspect">Halt, step, inspect</h3>

<p>The agent can freeze the CPU and see exactly where execution stopped — the program counter, the current function, the offset within it. From there, it can single-step through instructions, or read memory directly: RAM, flash, peripheral registers, anything in the address space.</p>

<p align="center"><a href="/assets/images/posts/debug-probe-mcp-server/debug_probe_demo_halt_status.png"><img src="/assets/images/posts/debug-probe-mcp-server/debug_probe_demo_halt_status.png" alt="Halt and inspect status" width="500" /></a></p>

<h3 id="breakpoints">Breakpoints</h3>

<p>The agent can set breakpoints by address or by function name (when an ELF is attached). Resume execution, and the target runs until the breakpoint fires. The server reports <em>why</em> execution stopped — software breakpoint, hardware breakpoint, manual halt, or something else.</p>

<div class="gif-expand">
  <a href="/assets/images/posts/debug-probe-mcp-server/debug_probe_demo_set_list_breakpoint.png"><img src="/assets/images/posts/debug-probe-mcp-server/debug_probe_demo_set_list_breakpoint.png" alt="Setting and listing breakpoints" /></a>
  <a href="/assets/images/posts/debug-probe-mcp-server/debug_probe_demo_test_breakpoint.png"><img src="/assets/images/posts/debug-probe-mcp-server/debug_probe_demo_test_breakpoint.png" alt="Testing breakpoint" /></a>
</div>

<p>When a workflow involves multiple steps — flash, wait for boot, set breakpoints, resume, check state — plugins let the agent run it as a single operation. The <a href="/2026/02/10/ble-mcp-server.html">BLE post</a> covers the poke→spec→plugin arc in detail.</p>

<hr />

<h2 id="elf-integration-the-agent-knows-your-symbols">ELF integration: the agent knows your symbols</h2>

<p>ELF (Executable and Linkable Format) is the standard binary format produced by embedded toolchains — it contains compiled code, section layout, and the symbol table that maps addresses to function and variable names.</p>

<p>Raw addresses are useful. Function names are better.</p>

<p><img src="/assets/images/posts/debug-probe-mcp-server/elf_file.png" alt="ELF integration" class="align-center" /></p>

<p>When you flash an ELF file or attach one to a session, the server parses the symbol table and enriches every response with symbol context. Halt the CPU and you don’t just get a raw program counter — you get <code class="language-plaintext highlighter-rouge">main+12</code>. Set a breakpoint by function name instead of a hex address. Look up a symbol and get its address, size, and type. Bidirectional, always available.</p>

<p align="center"><a href="/assets/images/posts/debug-probe-mcp-server/debug_probe_demo_status_elf.png"><img src="/assets/images/posts/debug-probe-mcp-server/debug_probe_demo_status_elf.png" alt="Status with ELF symbols" width="500" /></a></p>

<p>The agent reasons about your firmware in the same terms you do. Not “halted at 0x00003400” but “halted at sensor_read.” Not “breakpoint at 0x00002100” but “breakpoint at ble_on_connect.”</p>

<p>When the agent can map addresses to function names, it can form hypotheses about what the firmware is doing and why — not just report raw state.</p>

<hr />

<h2 id="svd-integration-memory-with-meaning">SVD integration: memory with meaning</h2>

<p>An ELF file tells the agent about <em>code</em> — functions, symbols, addresses.</p>

<p>An SVD file tells it about <em>hardware</em>.</p>

<p>SVD (System View Description) files are XML descriptions of a microcontroller’s peripheral register map — peripheral base addresses, register names and offsets, bitfields, enumerations, access permissions.</p>

<p>Without SVD, reading <code class="language-plaintext highlighter-rouge">0x40014000</code> returns raw bytes. With SVD attached, the agent can ask for <code class="language-plaintext highlighter-rouge">TIMER0.TASKS_START</code> by name and get back the value, the bitfields, and what they mean.</p>

<p><img src="/assets/images/posts/debug-probe-mcp-server/svd_file.png" alt="SVD integration" class="align-center" /></p>

<p>The agent doesn’t just see memory — it sees <em>intent</em>. Instead of guessing what <code class="language-plaintext highlighter-rouge">0x40014000</code> means, it can reason: <em>TIMER0 is running. TASKS_START is asserted. That explains the interrupt storm.</em></p>

<p>SVD support turns the debug probe from a byte-level tool into a hardware-aware reasoning surface.</p>

<p align="center"><a href="/assets/images/posts/debug-probe-mcp-server/debug_probe_demo_svd_list.gif"><img src="/assets/images/posts/debug-probe-mcp-server/debug_probe_demo_svd_list.gif" alt="Listing SVD peripherals and registers" width="500" /></a></p>

<div class="gif-expand">
  <a href="/assets/images/posts/debug-probe-mcp-server/debug_probe_demo_readmem_svd.png"><img src="/assets/images/posts/debug-probe-mcp-server/debug_probe_demo_readmem_svd.png" alt="Reading memory with SVD" /></a>
  <a href="/assets/images/posts/debug-probe-mcp-server/debug_probe_demo_ficr_svd.png"><img src="/assets/images/posts/debug-probe-mcp-server/debug_probe_demo_ficr_svd.png" alt="Reading FICR with SVD" /></a>
</div>

<hr />

<h2 id="rtt-logging-without-a-uart">RTT: logging without a UART</h2>

<p>RTT (Real-Time Transfer) uses the debug connection itself to stream data between the target and the host. The firmware writes to a small buffer in RAM; the probe reads it over SWD/JTAG in the background, without halting the CPU. No UART pins, no extra wiring, no baud rate configuration.</p>

<p>It sits in an interesting middle ground: not curated like a serial console, but not invasive like halting the core. The agent gets continuous visibility into firmware behavior while execution continues in real time.</p>

<p align="center"><a href="/assets/images/posts/debug-probe-mcp-server/debug_probe_demo_rtt.png"><img src="/assets/images/posts/debug-probe-mcp-server/debug_probe_demo_rtt.png" alt="RTT demo" width="500" /></a></p>

<hr />

<h2 id="getting-started">Getting started</h2>

<p>Install:</p>

<div class="language-bash highlighter-rouge"><div class="highlight"><pre class="highlight"><code>pip <span class="nb">install </span>dbgprobe-mcp-server
</code></pre></div></div>

<p>The MCP server does <strong>not</strong> include J-Link tools — you’ll need to install the <a href="https://www.segger.com/downloads/jlink/">SEGGER J-Link Software</a> separately. The server auto-detects <code class="language-plaintext highlighter-rouge">JLinkExe</code> and <code class="language-plaintext highlighter-rouge">JLinkGDBServer</code> on your system. For personal projects and education, SEGGER offers the <a href="https://www.segger.com/products/debug-probes/j-link/models/j-link-edu-mini/">J-Link EDU Mini</a> at a lower cost.</p>

<p><em>Not affiliated with or sponsored by SEGGER — it’s just what I had on my bench.</em></p>

<p>Register with Claude Code:</p>

<div class="language-bash highlighter-rouge"><div class="highlight"><pre class="highlight"><code>claude mcp add dbgprobe <span class="nt">--</span> dbgprobe_mcp
</code></pre></div></div>

<p>Optionally set a default target device and enable plugins:</p>

<div class="language-bash highlighter-rouge"><div class="highlight"><pre class="highlight"><code>claude mcp add dbgprobe <span class="se">\</span>
  <span class="nt">-e</span> <span class="nv">DBGPROBE_JLINK_DEVICE</span><span class="o">=</span>nRF52840_xxAA <span class="se">\</span>
  <span class="nt">-e</span> <span class="nv">DBGPROBE_MCP_PLUGINS</span><span class="o">=</span>all <span class="se">\</span>
  <span class="nt">--</span> dbgprobe_mcp
</code></pre></div></div>

<p>For VS Code + Copilot, add to <code class="language-plaintext highlighter-rouge">.vscode/mcp.json</code>:</p>

<div class="language-json highlighter-rouge"><div class="highlight"><pre class="highlight"><code><span class="p">{</span><span class="w">
  </span><span class="nl">"servers"</span><span class="p">:</span><span class="w"> </span><span class="p">{</span><span class="w">
    </span><span class="nl">"dbgprobe"</span><span class="p">:</span><span class="w"> </span><span class="p">{</span><span class="w">
      </span><span class="nl">"type"</span><span class="p">:</span><span class="w"> </span><span class="s2">"stdio"</span><span class="p">,</span><span class="w">
      </span><span class="nl">"command"</span><span class="p">:</span><span class="w"> </span><span class="s2">"dbgprobe_mcp"</span><span class="p">,</span><span class="w">
      </span><span class="nl">"env"</span><span class="p">:</span><span class="w"> </span><span class="p">{</span><span class="w">
        </span><span class="nl">"DBGPROBE_JLINK_DEVICE"</span><span class="p">:</span><span class="w"> </span><span class="s2">"nRF52840_xxAA"</span><span class="w">
      </span><span class="p">}</span><span class="w">
    </span><span class="p">}</span><span class="w">
  </span><span class="p">}</span><span class="w">
</span><span class="p">}</span><span class="w">
</span></code></pre></div></div>

<p>The tools will be available in Copilot Chat automatically.</p>

<hr />

<h2 id="safety">Safety</h2>

<p>The <a href="/2026/02/10/ble-mcp-server.html">BLE post</a> covers the safety philosophy in detail — anything that can affect real hardware is opt-in. A debug probe raises the stakes:</p>

<p><strong>Memory writes affect real hardware.</strong> A write to the wrong address can corrupt device state, overwrite calibration data, or put the chip in an unrecoverable state. Be aware of <em>what</em> and <em>where</em> you let the agent write.</p>

<p><strong>Flash operations are destructive.</strong> Flashing overwrites the chip’s program memory. If the new firmware is wrong, the device won’t boot. A mass erase will wipe all flash contents, including any data or keys stored on the device.</p>

<p><strong>Plugins execute code with hardware access.</strong> Same as the other servers — plugins are opt-in, contained to the project directory, and should be reviewed before enabling.</p>

<hr />

<h2 id="closing-thought">Closing thought</h2>

<p>Serial gives you what the firmware says. BLE gives you what it advertises. A debug probe gives you what it’s actually <em>doing</em> — instruction by instruction, register by register, byte by byte.</p>

<p>That changes what kind of problems it can help with. Not just “write the firmware” — but “the device hangs after five minutes, find out why.” Set a breakpoint, wait for it to trigger, inspect the stack, read the peripheral registers, form a hypothesis, test it. The same loop an engineer runs — but automated, repeatable, and stateful.</p>

<p>This doesn’t replace the engineer. It extends the engineer — with structured tools that drive the debug protocol directly, not text scraped from a CLI.</p>

<p>It gives the agent the same level of access you have when you’re at your most powerful — at the probe, halted at a breakpoint, staring at the stack.</p>

<p>When abstractions fail, you drop to the metal. Now the AI agent can too.</p>

<hr />

<h3 id="links">Links</h3>

<ul>
  <li>dbgprobe-mcp-server (source): <a href="https://github.com/es617/dbgprobe-mcp-server">GitHub</a></li>
  <li>dbgprobe-mcp-server (package): <a href="https://pypi.org/project/dbgprobe-mcp-server/">PyPI</a></li>
  <li>SEGGER J-Link Software: <a href="https://www.segger.com/downloads/jlink/">Downloads</a></li>
  <li>Serial MCP Server: <a href="https://github.com/es617/serial-mcp-server">GitHub</a></li>
  <li>BLE MCP Server: <a href="https://github.com/es617/ble-mcp-server">GitHub</a></li>
</ul>]]></content><author><name>Enrico Santagati</name></author><category term="mcp" /><category term="debug" /><category term="gdb" /><category term="jlink" /><category term="swd" /><category term="jtag" /><category term="python" /><category term="agents" /><category term="tooling" /><category term="hardware" /><category term="embedded" /><summary type="html"><![CDATA[What happens when the AI agent can halt the CPU, set breakpoints, flash firmware, and inspect memory directly?]]></summary></entry></feed>