Let the AI Out: Edge AI on a Microcontroller — From Zero to Inference in 90 Minutes
This post is part of the Let the AI Out series on giving AI agents direct access to hardware. Start here for the overview.
An ML engineer can train a keyword detection model in an afternoon. Deploying it on a microcontroller — Zephyr RTOS, CMSIS-NN kernels, memory alignment, tensor arena sizing, fixed-point FFT — takes weeks and a completely different skillset.
This post is about what happened when an AI agent with debug probe access was pointed at that problem. One Claude Code terminal session. 90 minutes. No code written by hand. No hardware physically touched. Never left the terminal. The result: 98ms end-to-end latency and 94.6% accuracy on real-world recordings.

This is a toy example — a known model, a known training sample. But the workflow is real. And what it demonstrates about the speed of iteration is the point.
Getting from zero to a working deployment in hours lets you focus your expert attention on the hard part — quantization tuning, power optimization, production robustness. The first 70% shouldn’t take weeks.
What this post covers
This post builds directly on the debug probe MCP server. If you haven’t read that one, the short version: the agent can flash firmware, halt the CPU, set breakpoints, read registers and memory — all through a J-Link debug probe over SWD/JTAG.
Here, the agent uses that foundation to deploy and iterate on an edge AI model. Along the way, it builds two custom plugins that turn the debug probe into an edge-AI development environment.
The embedded session replays show the actual agent sessions — edited for length, but with real tool calls and responses.
This is written for ML engineers who want to test models on real hardware — and for embedded engineers looking to accelerate their development workflow with agents.
The setup
The model is micro_speech — a TFLite Micro keyword spotting model from the TensorFlow examples. 18.8KB, int8 quantized, four classes: yes, no, silence, unknown. Designed specifically for microcontrollers.
The target is a Nordic nRF52840 development kit — ARM Cortex-M4F at 64 MHz, 1MB flash, 256KB RAM, running Zephyr RTOS. A common board, well-supported by Zephyr and CMSIS.
The agent is Claude Code with the debug probe MCP server installed — though any MCP-capable agent would work.
The starting point is Nordic’s Peripheral UART sample — a clean Zephyr project that exposes a UART interface over both serial and BLE. TFLite Micro was added on top of this existing firmware.
End-to-end inference looks like this: one second of audio goes in, preprocessing extracts MFCC features (49 frames × 40 coefficients, the spectral fingerprint of the audio), those features feed the neural network, and the network outputs confidence scores for each class.
1s @ 16kHz"] --> B["📊 Preprocessing
49 × 40 MFCC"] B --> C["🧠 TFLite Micro
18.8KB int8"] C --> D["📋 Output
yes / no /
silence / unknown"] style A fill:#1a365d,stroke:#63b3ed,stroke-width:2px,color:#fff style B fill:#4a1942,stroke:#f687b3,stroke-width:2px,color:#fff style C fill:#2d1b69,stroke:#b794f4,stroke-width:2px,color:#fff style D fill:#1a365d,stroke:#63b3ed,stroke-width:2px,color:#fff
For simplicity, there is no microphone or PDM/I2S input in this setup. Audio is injected through the debug probe — the agent writes raw PCM data directly into the device’s memory and triggers the on-device preprocessing and inference pipeline.
The session
The entire deployment happened in a single Claude Code session, roughly 90 minutes. No code written by hand, no hardware physically touched, never left the terminal. A few steering interventions made the difference — step back, simplify, and redirect when the agent was overcomplicating things. No predefined instructions were used — no CLAUDE.md, no custom skills. With them, the agent can skip the discovery phase and go straight to building.
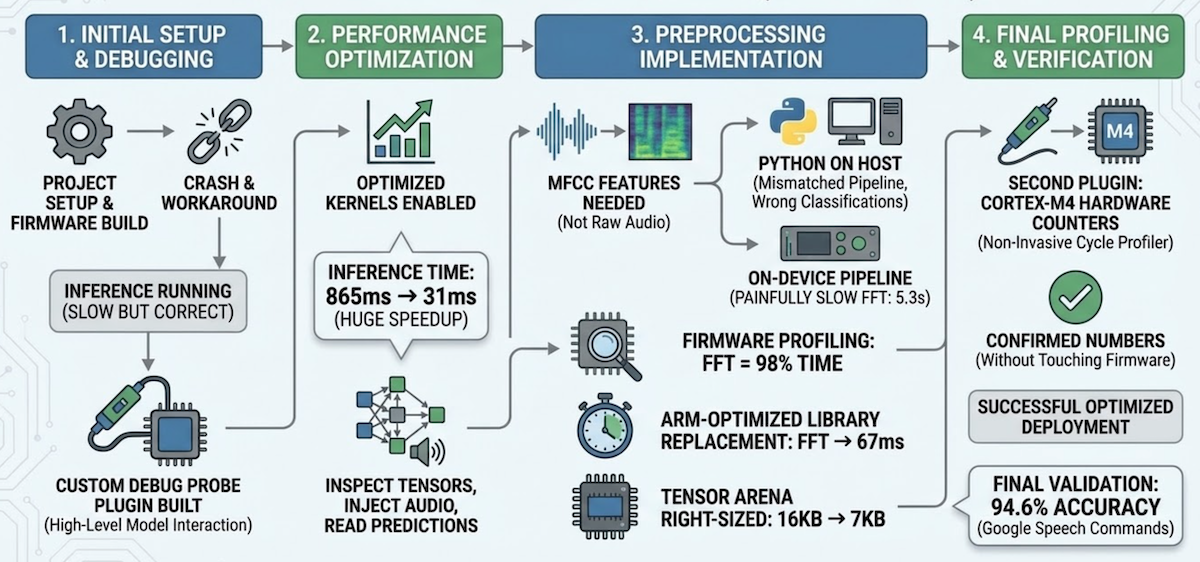
1. Initial setup & debugging (~24 min)
The agent set up the project, built and flashed firmware, hit a hard fault, and worked around it by disabling optimized kernels. First inference: 865ms — slow but correct. It then built a custom debug probe plugin — the TFLite Micro inspector — to interact with the model at a higher level — inspect tensors, inject audio, read predictions — instead of raw memory addresses.
2. Performance optimization (~7 min)
With the plugin in place, the agent went back and fixed the root cause. CMSIS-NN — ARM’s optimized neural network kernels, the embedded equivalent of cuDNN — uses SIMD instructions that require aligned memory access. The model data array had no alignment constraint, so the linker placed it at an arbitrary address and CMSIS-NN’s LDRD instructions faulted. One-line fix: alignas(16) on the model array. Inference dropped from 865ms (reference kernels) to 31ms with CMSIS-NN — a 28x speedup.
3. Preprocessing implementation (~47 min)
The model expects MFCC features — a spectral fingerprint of the audio — not raw waveforms. To test with real recordings, those features need to be extracted somewhere: either on the host in Python, or on the device in firmware. The agent started with Python (librosa), which is faster to iterate on. It ran, but classifications were wrong — training/serving skew. The model was trained with a specific fixed-point preprocessing pipeline that includes spectral subtraction and per-channel automatic gain control — steps that don’t exist in standard MFCC extraction. The features looked right but were semantically wrong.
Pivoted to implementing the exact training pipeline in firmware. Correct classifications, but preprocessing took 5.3 seconds. Switching the compiler to optimize for speed cut it to 2.6 seconds. Per-step profiling revealed the FFT was 98% of the remaining time — replacing Kiss FFT with ARM’s CMSIS-DSP arm_rfft_q15 brought preprocessing to 67ms.
| Change | Preprocessing | Flash |
|---|---|---|
| Initial (Kiss FFT, optimize for size) | 5,348 ms | 342 KB |
| Optimize for speed | 2,616 ms | 372 KB |
| ARM-optimized FFT | 67 ms | 442 KB |
The agent then tried to optimize the remaining preprocessing steps with CMSIS-DSP intrinsics — each attempt either broke accuracy or ran slower, so all were reverted. The compiler’s -O2 was already doing a good job on those small loops. The tradeoff: flash grows from 342KB to 442KB. On a chip with 1MB of flash, that’s fine — but on a tighter budget you’d weigh that differently.
4. Final profiling & verification (~15 min)
Using the plugin’s arena_info tool, the agent found only 6,948 bytes used out of 16,384 allocated — and right-sized the tensor arena to 7KB, saving 9KB of RAM. The agent initially instrumented the firmware with timestamps for profiling. I steered it toward using the Cortex-M4’s DWT cycle counter instead — hardware profiling with zero firmware changes. That led to a second plugin — the Cortex-M profiler — non-invasive cycle counting through the debug probe. Final validation — automated through the plugin’s accuracy_test tool — against 130 real-world recordings from the Google Speech Commands dataset: 94.6% accuracy.
Final numbers:
| Metric | Value |
|---|---|
| Preprocessing | 67 ms |
| Inference | 31 ms |
| Total end-to-end | 98 ms |
| Flash | 442 KB (42% of 1 MB) |
| RAM | 120 KB (46% of 256 KB) |
| Tensor arena | 7 KB (97% utilized) |
The agent also documented the entire process as a technical setup guide — build instructions, troubleshooting, per-step profiling data, and optimization history — so a human engineer can reproduce or continue the work.
The two plugins
Two Python files — the TFLite Micro inspector and the Cortex-M profiler — turned the debug probe from a byte-level tool into an edge-AI development environment.
These are the third stage of the poke→spec→plugin arc — but here, the agent built its own plugins during the session, then used them to accelerate everything that followed. The plugin creation itself took 6 minutes. The time saved by having structured tools instead of raw memory access was far greater.
9 tools"] P2["🔌 cortex_m_profiler
3 tools"] B["🔧 built-in tools
flash, halt, r/w
breakpoints"] end S --> H["📡 nRF52840"] style A fill:#2d1b69,stroke:#b794f4,stroke-width:2px,color:#fff style P1 fill:#4a1942,stroke:#f687b3,stroke-width:2px,color:#fff style P2 fill:#4a1942,stroke:#f687b3,stroke-width:2px,color:#fff style S fill:#1a1a2e,stroke:#f687b3,stroke-width:2px,color:#fff style H fill:#1a365d,stroke:#63b3ed,stroke-width:2px,color:#fff
TFLite Micro inspector (9 tools) — model-level interaction. The agent reasons about the ML model, not memory addresses.
| Tool | What it does |
|---|---|
model_info |
Read model metadata from flash (size, FlatBuffer ID, schema version) |
arena_info |
Read tensor arena address, total/used size, utilization % |
tensor_info |
Read input/output buffer addresses, sizes, quantization params |
write_input |
Write features to input tensor (from .bin file, .hex, or test pattern) |
write_pcm |
Write a .wav file as raw PCM, run on-device preprocessing + inference |
infer |
Trigger inference on current input tensor contents |
read_output |
Read output scores (raw int8 + dequantized floats with class labels) |
read_input |
Read input tensor summary (min/max/mean/non-zero count) |
accuracy_test |
Batch accuracy test over a directory of labeled .wav files |
All addresses are resolved automatically via ELF symbol lookup inside the debug probe MCP server — the agent never deals with raw addresses, and the tools keep working across rebuilds. Output scores are dequantized for human-readable results:
predicted_class: "yes"
confidence: 99.6%
categories: silence=0.0%, unknown=0.0%, yes=99.6%, no=7.0%
Cortex-M profiler (3 tools) — non-invasive hardware cycle counting, zero firmware changes.
| Tool | What it does |
|---|---|
dwt_setup |
Enable DWT cycle counter (set TRCENA in DEMCR, CYCCNTENA in DWT_CTRL) |
dwt_read |
Read current CYCCNT value, optionally reset |
measure |
Measure CPU cycles between two breakpoint addresses |
Both plugins work with any TFLite Micro model on any Cortex-M target — class labels, model symbols, and CPU frequency are configurable. Available in the dbgprobe-mcp-server and nrf52840-edge-ai repositories.
What this means for ML engineers
If you’ve trained a model and want to test it on real hardware — not ship it to production, but try it and learn the embedded side along the way — this workflow gets you there in hours instead of weeks.
You don’t need to learn Zephyr or CMake. You don’t need to understand linker scripts or debug hard faults manually. You don’t need to write fixed-point DSP code by hand or instrument firmware for profiling. The agent handles the embedded plumbing. You focus on what you know: is the model working? Are the classifications correct? Is the latency acceptable?
Think of it as running a model in a Jupyter notebook before building the serving infrastructure — except the notebook is running on real silicon. The tensor arena is like a pre-allocated memory pool for intermediate activations (similar to how TensorFlow manages GPU memory, but with a fixed budget set at compile time). CMSIS-NN is the embedded equivalent of cuDNN — optimized kernels for common neural network layers.
This is not production deployment. The firmware the agent writes needs review. The memory layout needs hardening. Power management is nonexistent. But as a prototyping and validation tool — getting to “yes, this model runs on this chip, here are the real numbers on real silicon” — it collapses the timeline dramatically.
Getting from zero to 70% fast lets you spend your expert attention on the hard 30% — power optimization, edge cases, production robustness, certification. The piping, the configuration, the build-flash-test iteration — that’s what the agent accelerates.
Closing thought
The earlier posts in this series gave the agent access to hardware surfaces — BLE, serial, debug probes. This post is different. It isn’t about building a new MCP server. It’s about what happens when you combine an existing tool — the debug probe MCP server — with domain-specific plugins and point them at a real problem.
The session took 90 minutes. Doing the same work manually — Zephyr setup, TFLite Micro integration, CMSIS-NN debugging, fixed-point FFT conversion, profiling — typically takes days. Not because it’s conceptually hard, but because every step involves build systems, toolchain quirks, and hardware debugging. The agent handles the plumbing. The engineer directs the intent.
The interesting shift isn’t “AI that writes firmware.” It’s AI that iterates on the physical behavior of a real system — flashing, observing, measuring, adjusting — in a tight loop. Edge AI deployment is one example. The pattern applies anywhere the gap between software intent and physical behavior needs to close.